Last updated 13 October 2026.
Silver
Element 47 · Transition metal · By-product of lead, zinc, copper and gold1
Most silver comes as a by-product of mines for lead, zinc, copper and gold. Mexico produces the most. People have mined silver for about 5,000 years, for coins, jewelry and tableware. Today industry uses more than half of it, in electronics, solar cells and brazing alloys. Most of the rest goes into coins and bars for investors, and into jewelry. The price rose to records in 2025 and to more than $121 per troy ounce in January 2026.
How silver compares
Produced each year ~ 26 thousand tonnes a year 1 Other sources: 26.3 thousand tonnes a year in 2025 (Metals Focus, 2026)2. Cd He Po C How we get it →
The scales are log scales, except for the shares, which go from 0 to 100%.
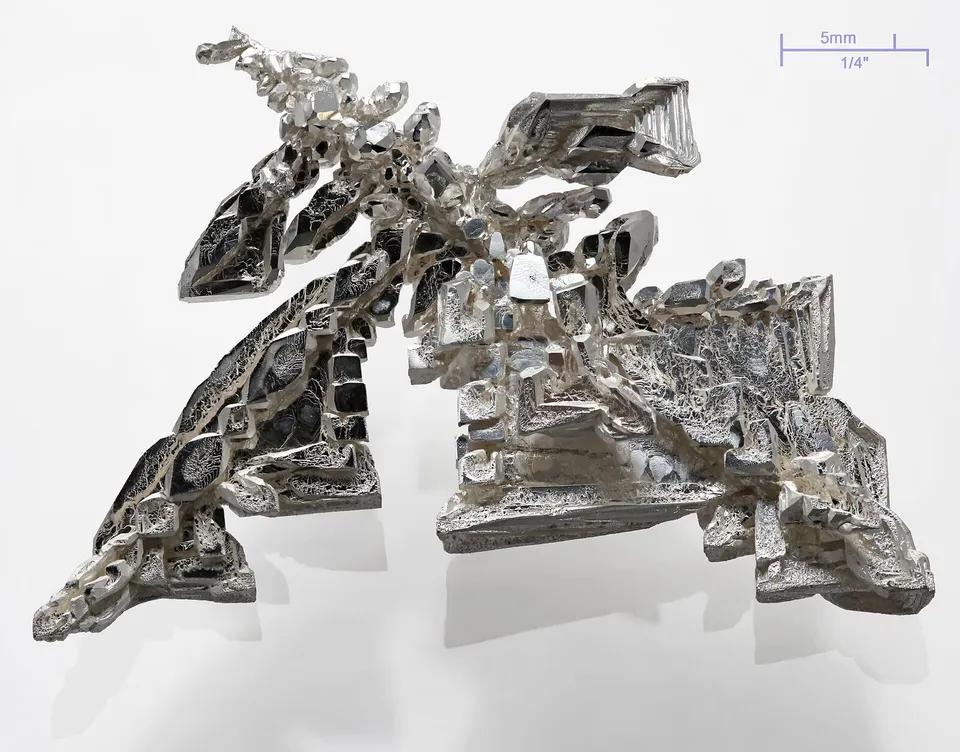

Specimen
- Atomic number
- 47
- Atomic mass
- 107.87
- State at room temperature
- Solid
- Melting point
- 961.8 °C
- Boiling point
- 2,162 °C
- Density
- 10.5 g/cm³
- Discovered
- Ancient
Can I eat it?
Learn about silver
- 01 How much there is And how much of that can we reach? Silver is rare in the crust, at less than a tenth of a gram per tonne of rock. USGS puts world reserves at 610,000 tonnes, about 23 years of mine output at the rate of 2025. Most of it lies in ores of other metals. Read →
- 02 Where it is found What is it found in, and where on Earth? The main source is galena, a lead ore that contains silver. Silver also comes from copper and gold ores, and from veins rich in silver near old volcanoes, as in Mexico and Peru. Read →
- 03 How we get it How much do we make each year, and how? Mines produced about 26,000 tonnes of silver in 2025, by USGS estimate. Mexico, Peru and China produced about half of it. Recycling added about 6,100 tonnes, by Metals Focus figures. Read →
- 04 What we use it for Where does it go, and why this element? Industry used 58% of the world's silver in 2025, mostly in electronics and solar cells. Investors bought 19% as coins and bars, and jewelry took 17%. Silver conducts electricity and reflects light better than any other metal. Read →
- 05 What it costs What does it cost, and how is it bought and sold? Silver averaged about $38 per troy ounce in the United States in 2025, 34% more than in 2024. It reached a record of more than $121 in January 2026. Both investors and industry move the price. Read →
- 06 Who controls it Who controls the supply, and who depends on it? Supply is spread over many countries. Mexico mines about a quarter of the world's silver, and no other country mines more than 14%. The United States added silver to its list of critical minerals in 2025. The EU and the UK do not count it as critical. Read →
- 07 Social and political problems What problems does it cause between people, and who carries them? Spain took silver from Potosí in Bolivia with the forced labor of Indigenous people. Children still work in Bolivian mines, by US government findings. In Guatemala, a court stopped a large silver mine in 2017 for lack of consultation. Read →
- 08 History How did our relationship with it begin and change? People have mined silver for about 5,000 years. For most of that time it was money. Silver from Laurion and the Comstock Lode helped to pay for wars. Silver from Potosí helped Spain become a world power. Read →
Worth knowing
-
In World War II, the Manhattan Project borrowed about 395 million troy ounces of silver from US government vaults. That is about 12,300 tonnes. The silver went into the magnets that enriched uranium for the first atomic bomb. 11
History → -
Of all metals, pure silver has the whitest color, reflects the most light, and conducts heat and electricity best. 12
What we use it for → -
Only 26% of mined silver came from mines where silver is the main product in 2025. The rest came from mines for lead, zinc, copper and gold. 2
Where it is found → -
When the price rose in 2025, silver went from 8 to 10% of the cost of a solar cell to more than 20%, by Metals Focus figures. 2
What we use it for → -
Too much silver over a long time can turn the skin blue-gray. The change, called argyria, is permanent. 13
-
Silver threads in the fingertips of gloves let people use touchscreen phones while they wear them. 14
What we use it for →
The atom
Electrons
| Shell | Electrons |
|---|---|
| 1 (K) | 2 |
| 2 (L) | 8 |
| 3 (M) | 18 |
| 4 (N) | 18 |
| 5 (O) outermost | 1 |
| Total | 47 |
Configuration [Kr] 4d¹⁰ 5s¹
4d ↑ ↓ ↑ ↓ ↑ ↓ ↑ ↓ ↑ ↓
5s ↑
Nucleus
| Protons | 47 |
|---|---|
| Neutrons | 60 |
| Mass number | 107 |
Related elements
New articles by e-mail
Sources
- 1
Anne M. Hartingh, U.S. Geological Survey, 2026. Silver, in Mineral Commodity Summaries 2026 , Domestic Production and Use; Salient Statistics; Recycling; Import Sources; Events, Trends, and Issues; World Mine Production and Reserves; World Resources; Substitutes.
Mine production and reserves by country, US uses, prices, imports and recycling, the 2025 US critical list, and substitutes.
-
silver was primarily obtained as a byproduct from lead-zinc, copper, and gold mines
-
2,110 2,100 25,300 26,000
-
1,100 1,000 7,600 300 9,400 38
-
1,100 774 800 1,050 1,000 1,490 1,500 e 366 400 e 1,200 1,400 3,430 3,400 700 800 e 850 630 5,780 6,300 3,510 3,600 1,320 1,300 1,280 1,200 432 400 2,110 2,100 25,300 26,000
-
- 2
The Silver Institute (prepared by Metals Focus), 2026. World Silver Survey 2026 , Summary; Chapter 2 (Market Outlook); Chapter 4 (Mine Supply, Primary Silver Production Costs); Chapter 6 (Bullion flows); Chapter 7 (Industrial & Photography, PV focus box); Appendix 1 (tons).
World supply and demand of silver by use, 2017 to 2025, mine supply by source metal, costs, prices and trade in 2025. The Silver Institute is an association of the silver industry.
-
mine production rose by 3% to 846.6Moz (26,331t)
-
2025 Silver Price ($40.03/oz)
-
global supply from primary silver mines fell to a new low of 26%
-
jumping from 8–10% of the cost of solar cells at the beginning of last year to over 20%
-
- 3
Theodore Gray (data from Wolfram ElementData), 2026. Technical data for Silver .
Abundance of silver in the crust, the oceans and the universe.
-
% in Earth's Crust 7.9×10⁻⁶%
-
- 4
UK Critical Minerals Intelligence Centre, British Geological Survey, 2024. UK 2024 Criticality Assessment , Table of end-of-life recycling rates; criticality results table.
Silver's end-of-life recycling rate and its 2024 criticality score.
-
Silver (Ag) 46
-
- 5
UNEP International Resource Panel (T.E. Graedel et al.), 2011. Recycling Rates of Metals: A Status Report , Table 3; Appendix E.
End-of-life recycling rates, recycled content and old scrap ratios for 60 metals.
-
Ag 76c, 77d, > 80 20e, 30d, 32c 58d, 97c, 30–50
-
- 6
IUPAC Commission on Isotopic Abundances and Atomic Weights (CIAAW), 2024. Abridged Standard Atomic Weights 2024 .
The atomic mass shown for the 84 elements that have a standard atomic weight.
- 7
National Center for Biotechnology Information (PubChem), 2026. Periodic Table of Elements .
Electron configuration, melting and boiling points, density and discovery year for all 118 elements.
- 8
EFSA Panel on Food Additives and Flavourings (FAF), EFSA Journal, 2025. Follow-up of the re-evaluation of silver (E 174) as a food additive (EFSA-Q-2023-00169) .
-
Silver (E 174) is authorised for use as a food additive in the Union. ... the Panel could not conclude on the safety of the food additive silver E 174.
-
- 9
Agency for Toxic Substances and Disease Registry (ATSDR), 1990. ToxFAQs for Silver .
-
Exposure to high levels of silver for a long period of time may result in a condition called arygria, a blue-gray discoloration of the skin and other body tissues.
-
- 10
European Commission, 2011. Commission Regulation (EU) No 1129/2011 establishing a Union list of food additives , Annex, Parts B and E.
The text as adopted by the EU in 2011, from legislation.gov.uk. Later EU amendments are not in it.
-
E 174 Silver quantum satis only external coating of confectionery
-
E 174 Silver quantum satis only liqueurs
-
- 11
US National Park Service (Manhattan Project National Historical Park), 2026. Beta 3 at Y-12 .
The silver that the Manhattan Project borrowed from US government vaults for the calutron magnets at Oak Ridge.
-
The Manhattan Project secured approximately 13,540 short tons (395 million troy ounces) of silver from federal government vaults at West Point, New York.
-
- 12
U.S. Geological Survey (William E. Brooks), 2013. Silver, in Metal Prices in the United States Through 2010 (Scientific Investigations Report 2012-5188) , Silver (Ag), pp. 167 to 169.
The history of silver as money and the US silver price to 2010, ores, properties and industrial uses.
-
Pure silver has the whitest color, the highest optical reflectivity, and the highest thermal and electrical conductivity of all the metals.
-
- 13
Agency for Toxic Substances and Disease Registry (ATSDR), US Department of Health and Human Services, 1999. ToxFAQs for Silver .
Health effects of silver, argyria, and US limits for drinking water and workplace air.
-
a blue-gray discoloration of the skin and other body tissues ... Argyria is a permanent effect
-
- 14
Royal Society of Chemistry, 2026. Silver - Element information, properties and uses , Uses and properties; Biological role; Natural abundance; History; podcast 'Chemistry in its element: silver' (Victoria Gill).
Uses, ores and history of silver, its name, and its role in photography.
-
Silver threads are woven into the fingertips of gloves so that they can be used with touchscreen phones.
-
- 15
National Institute of Standards and Technology (NIST), 2026. Atomic Weights and Isotopic Compositions for All Elements .
Isotopic composition of each element; the most abundant isotope sets the neutron count in the nucleus view.