EU business AI use (Eurostat)
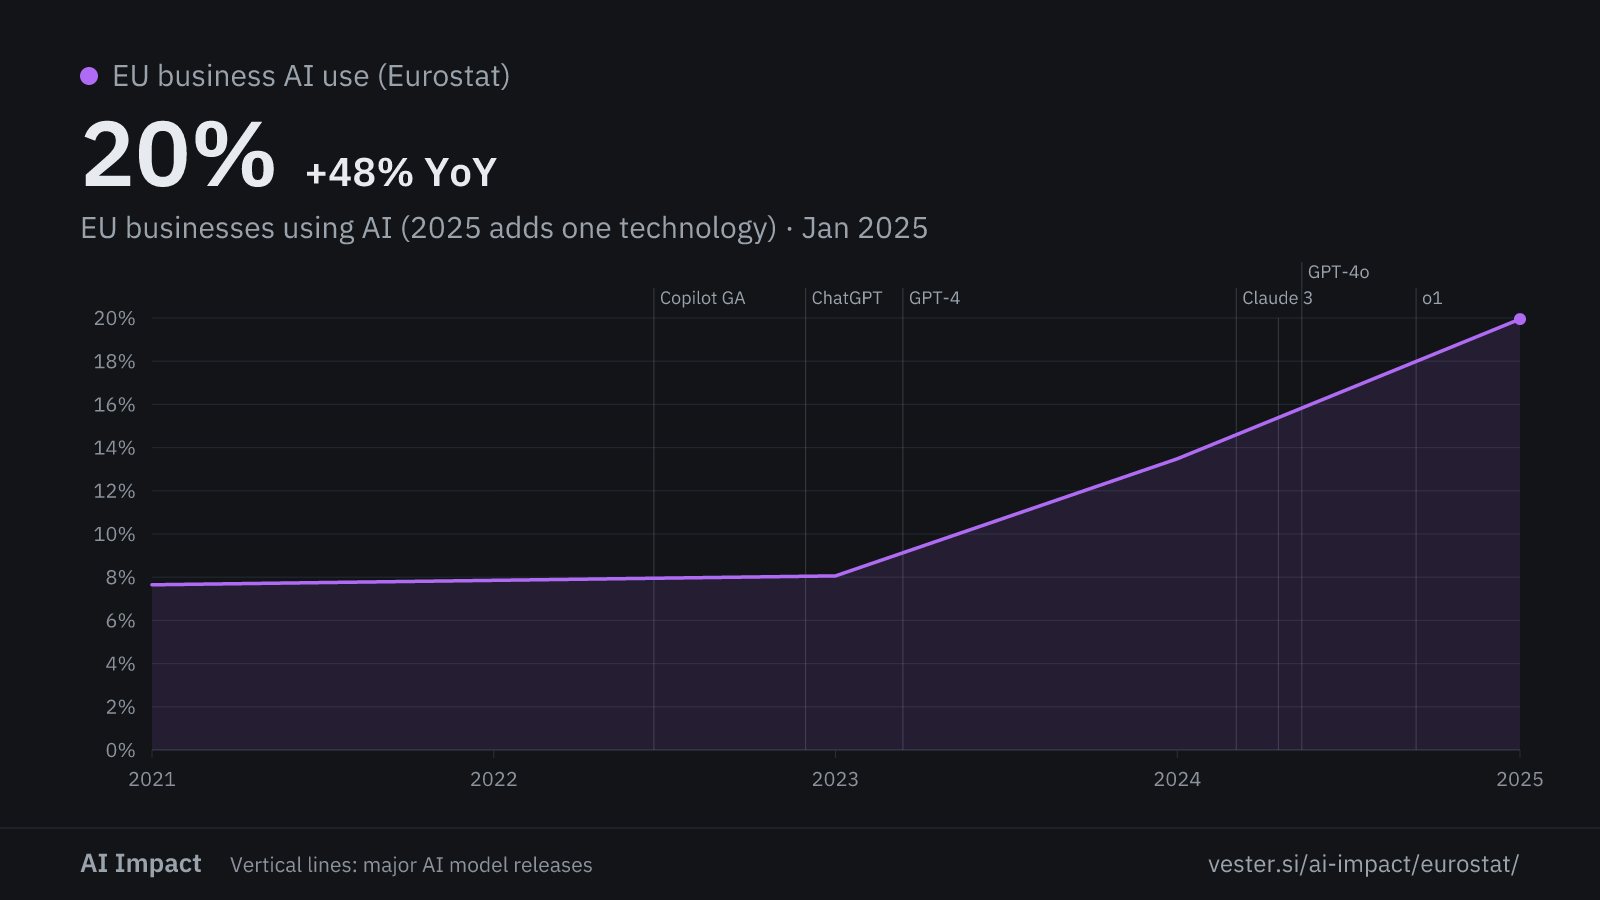
How many businesses in the European Union use artificial intelligence, from Eurostat's survey of about 157,000 enterprises with 10 or more employees. Eurostat ran the AI questions in 2021, 2023, 2024 and 2025, so every line here has four points and there is no 2022. The next year arrives in December 2026.
In 2025 Eurostat added image, video and audio generation to its list of AI technologies. Part of the rise in 2025 comes from the new answer, not from new use.
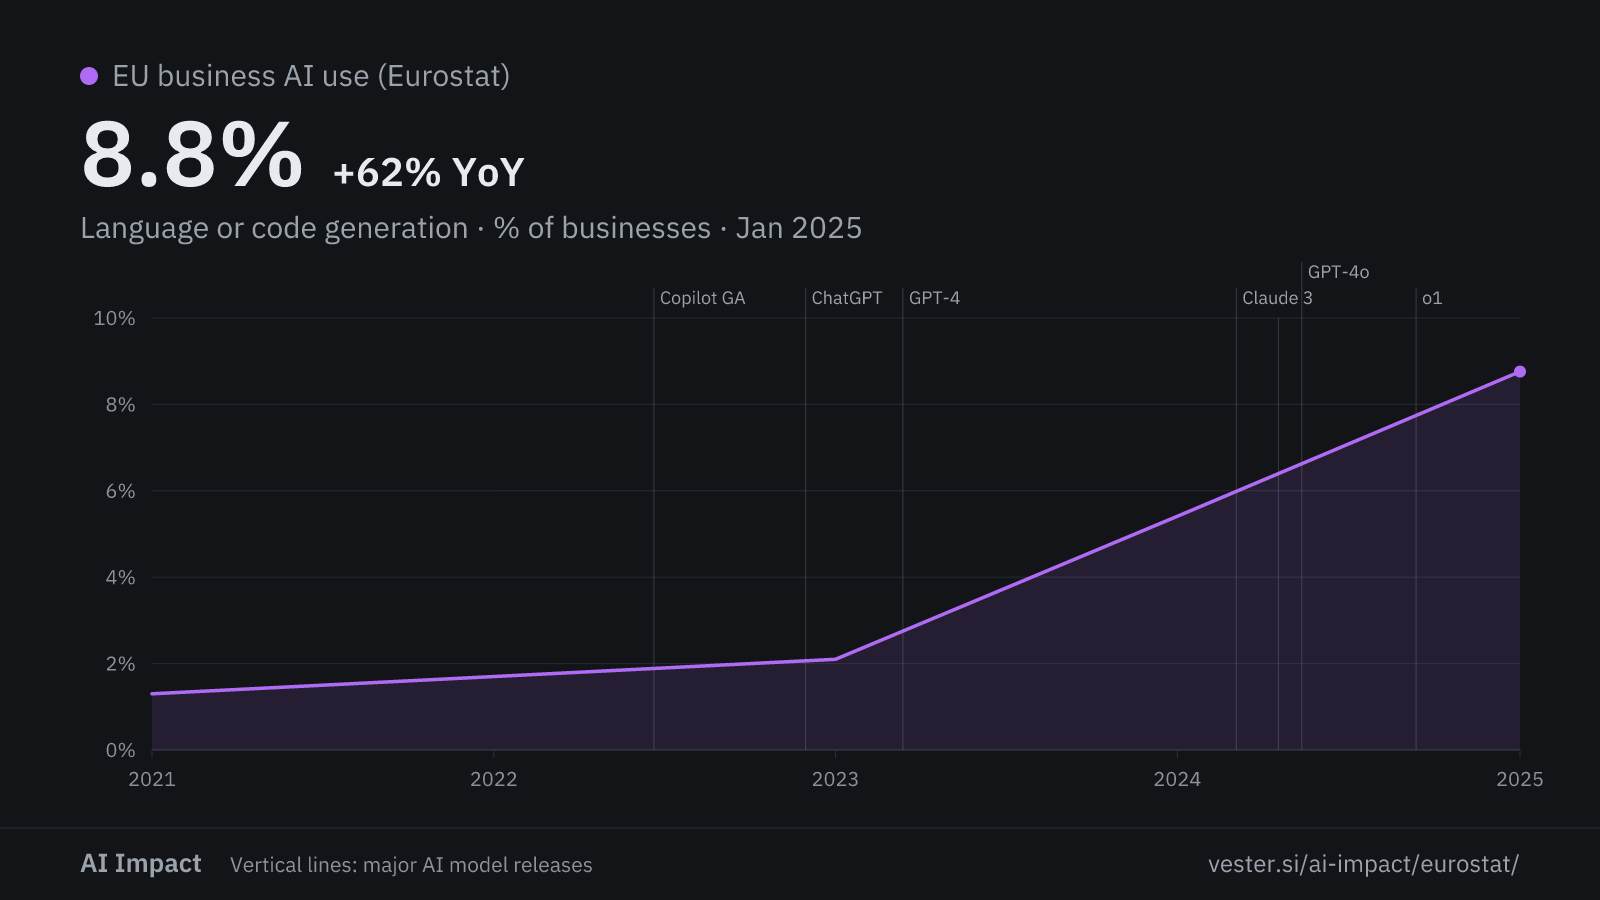
By technology
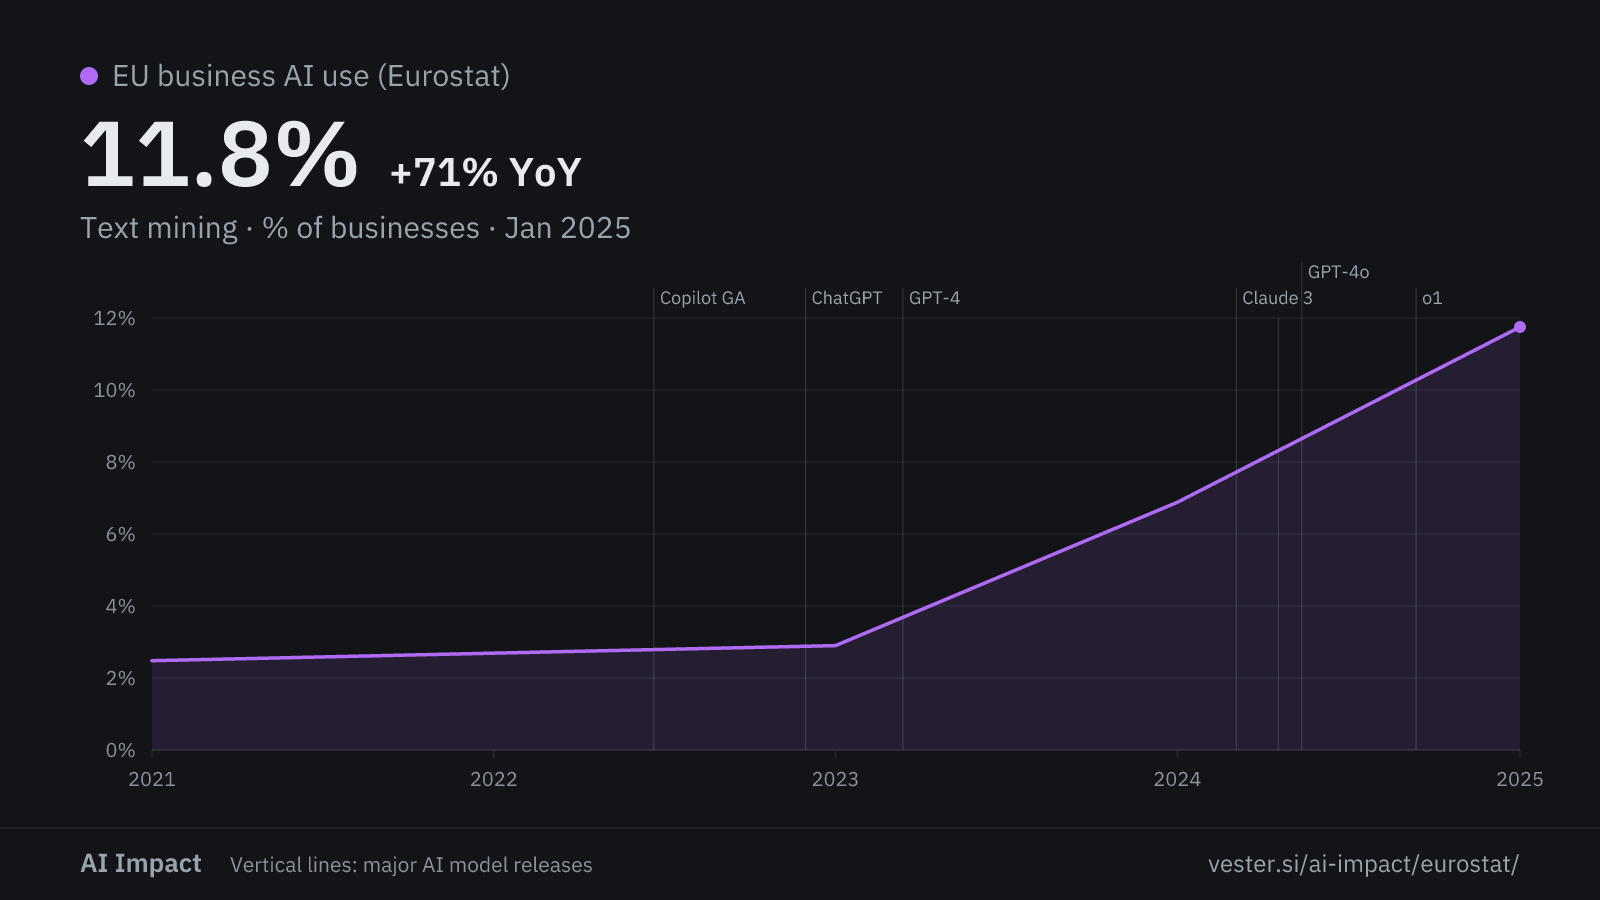
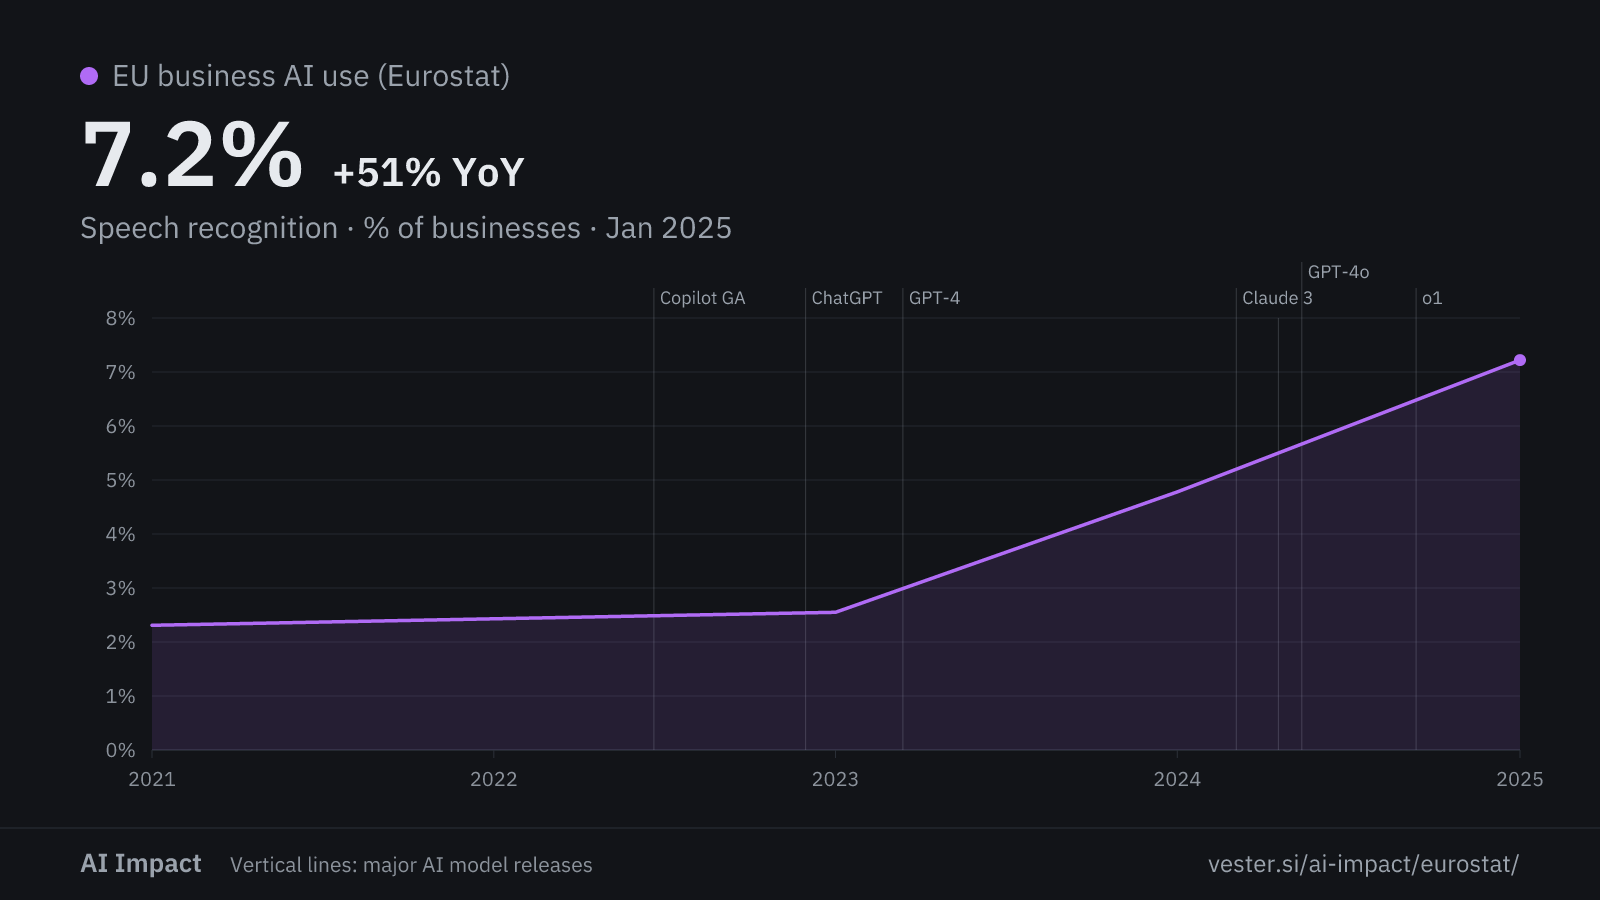
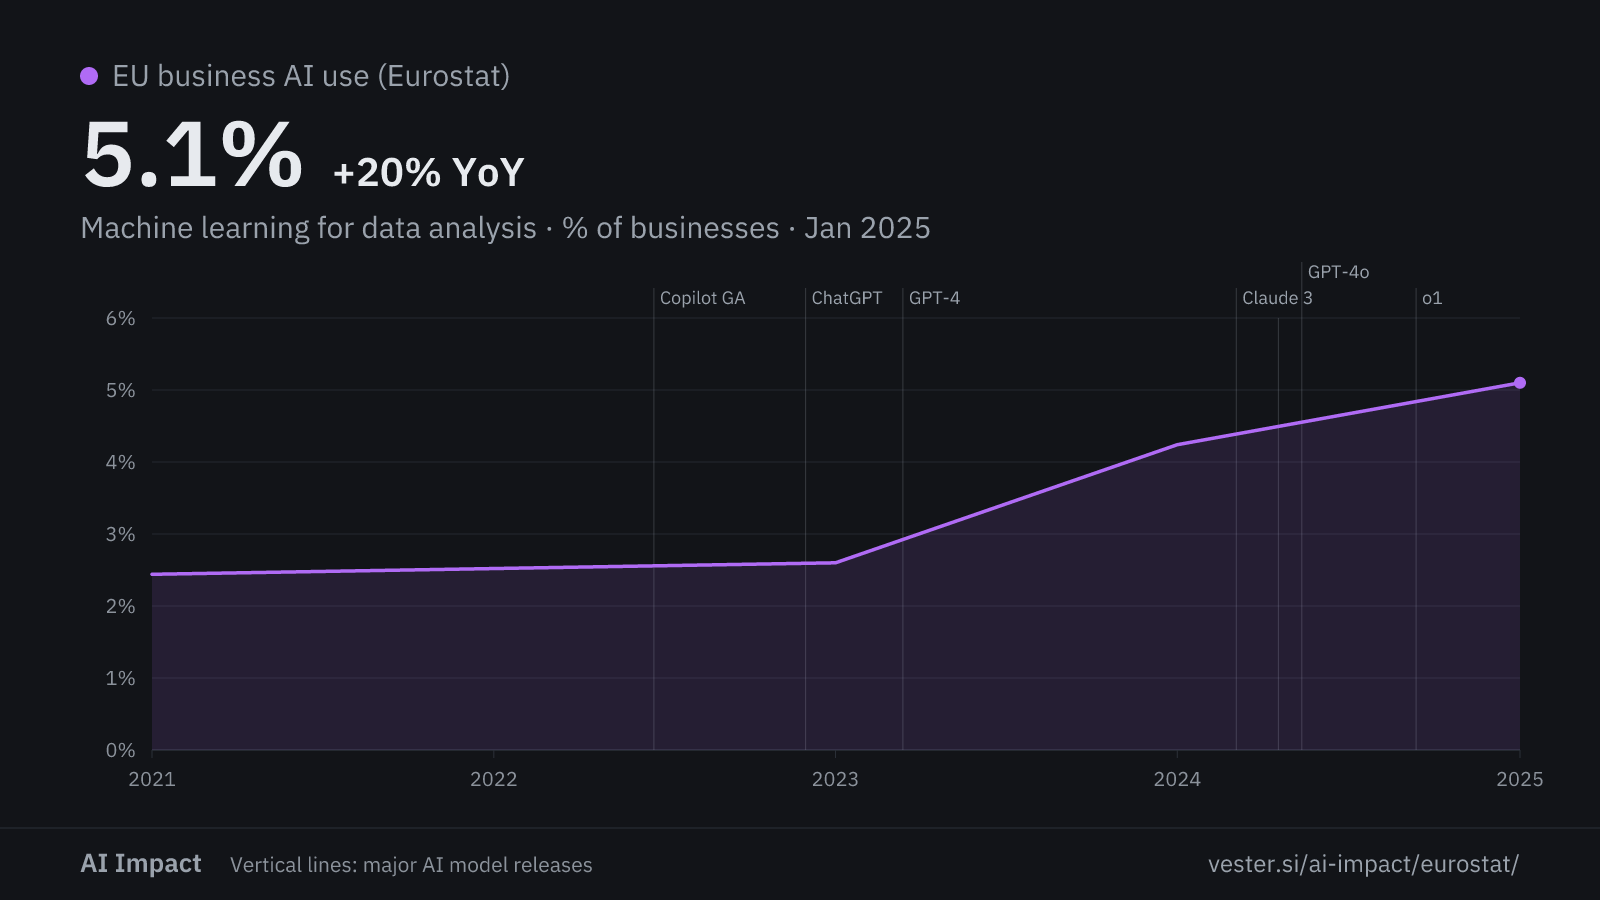
Eurostat asked the same question about seven of these technologies in all four years. It asked about image, video and audio generation for the first time in 2025.
Text mining
Speech recognition
Machine learning for data analysis
Workflow automation
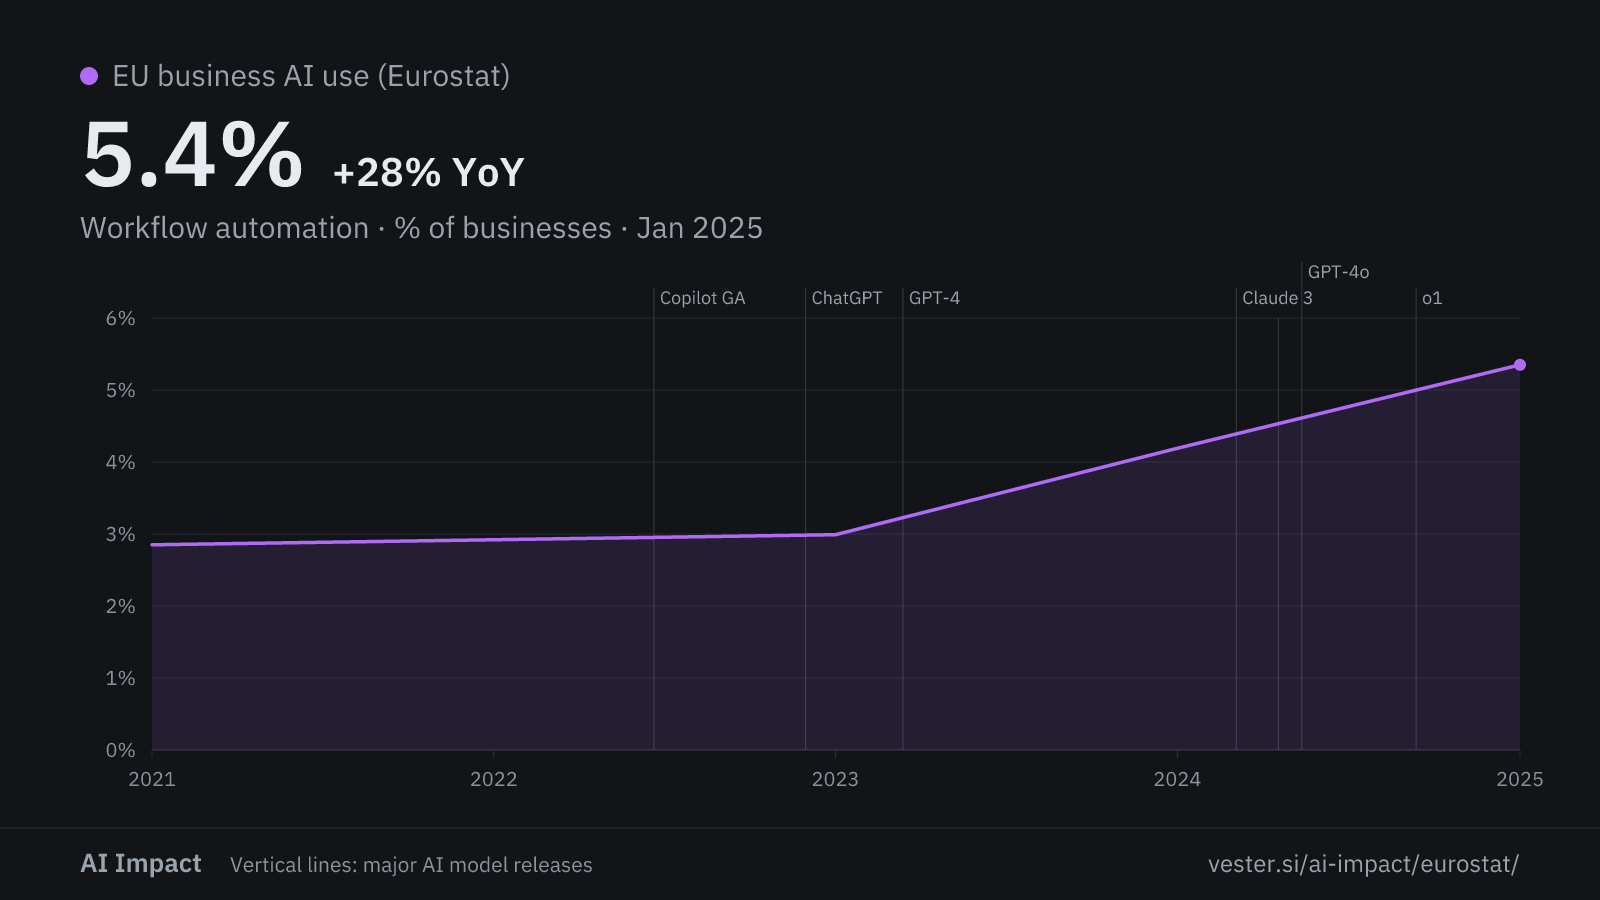
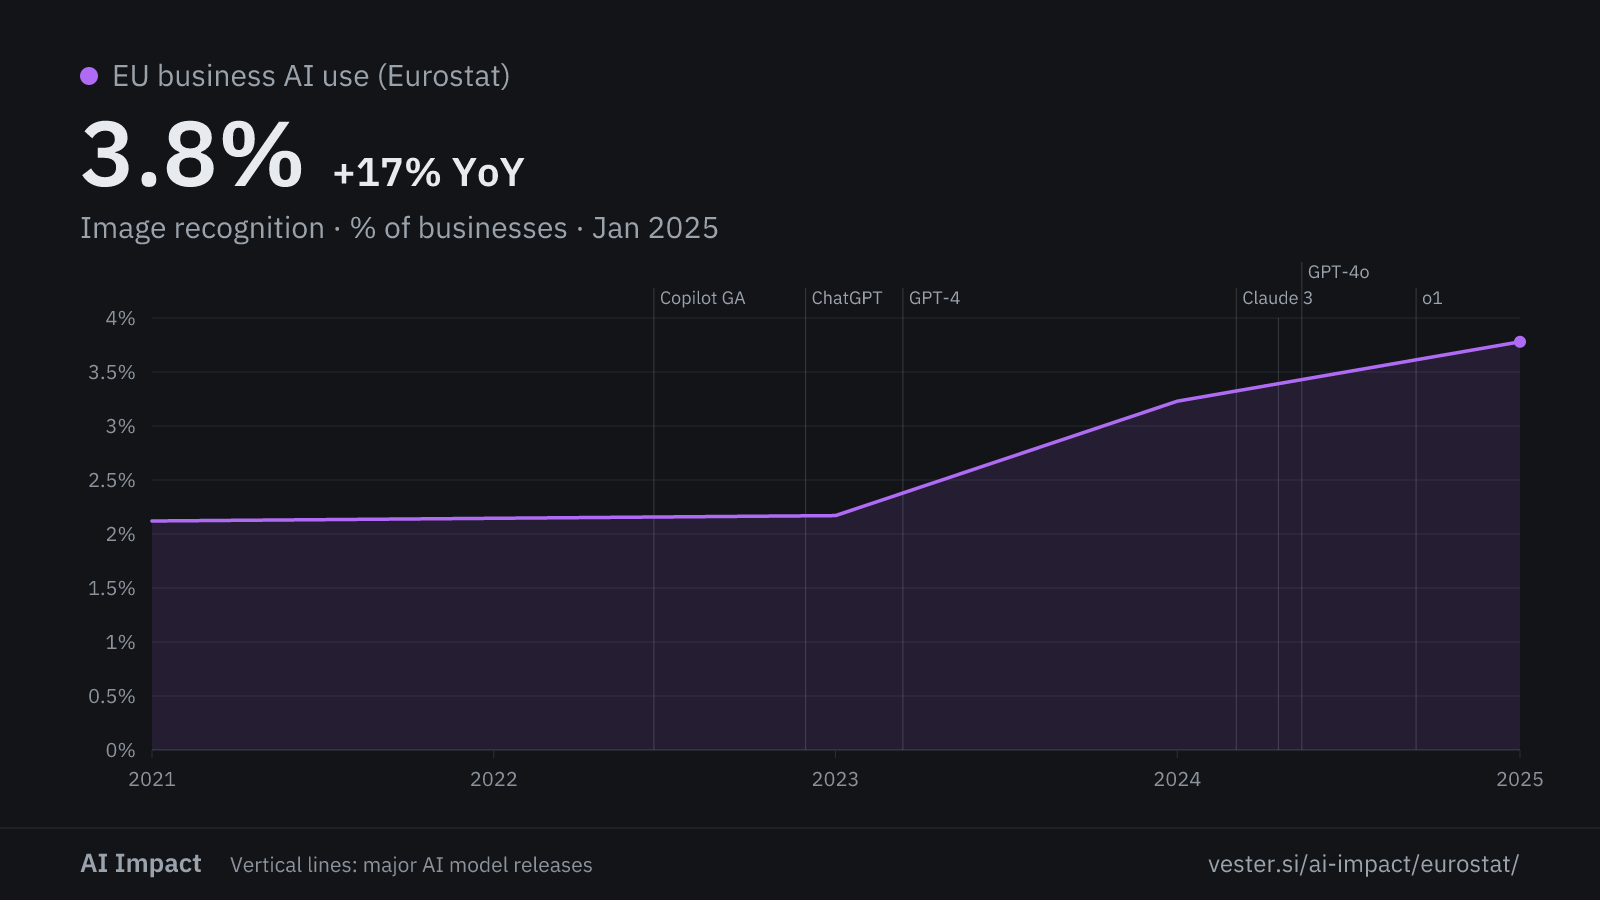
Image recognition
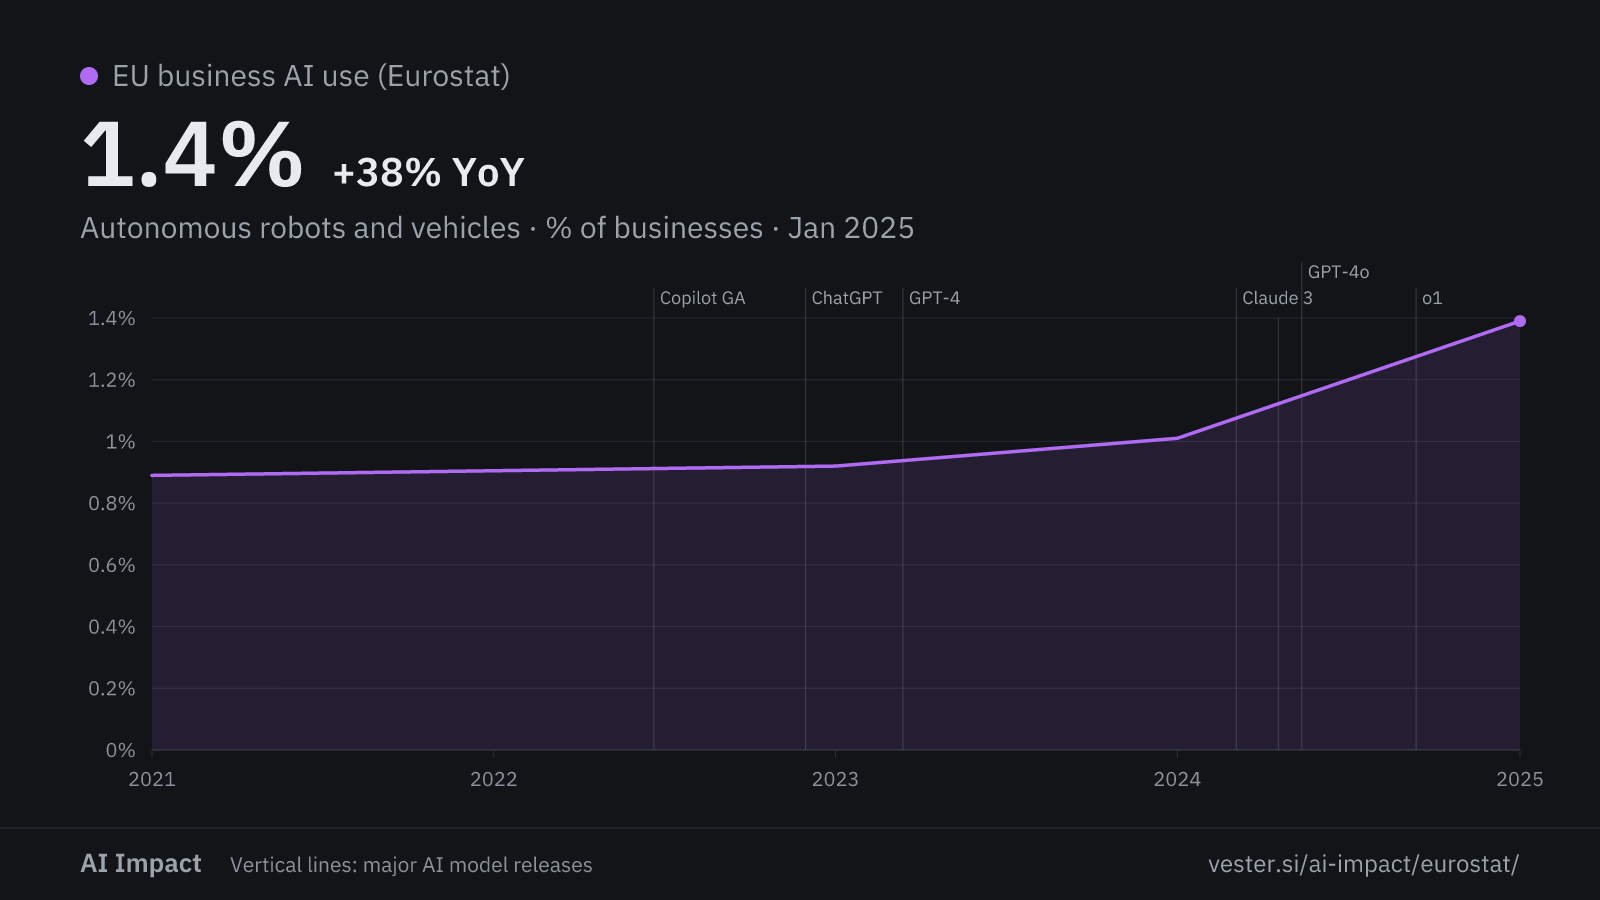
Autonomous robots and vehicles
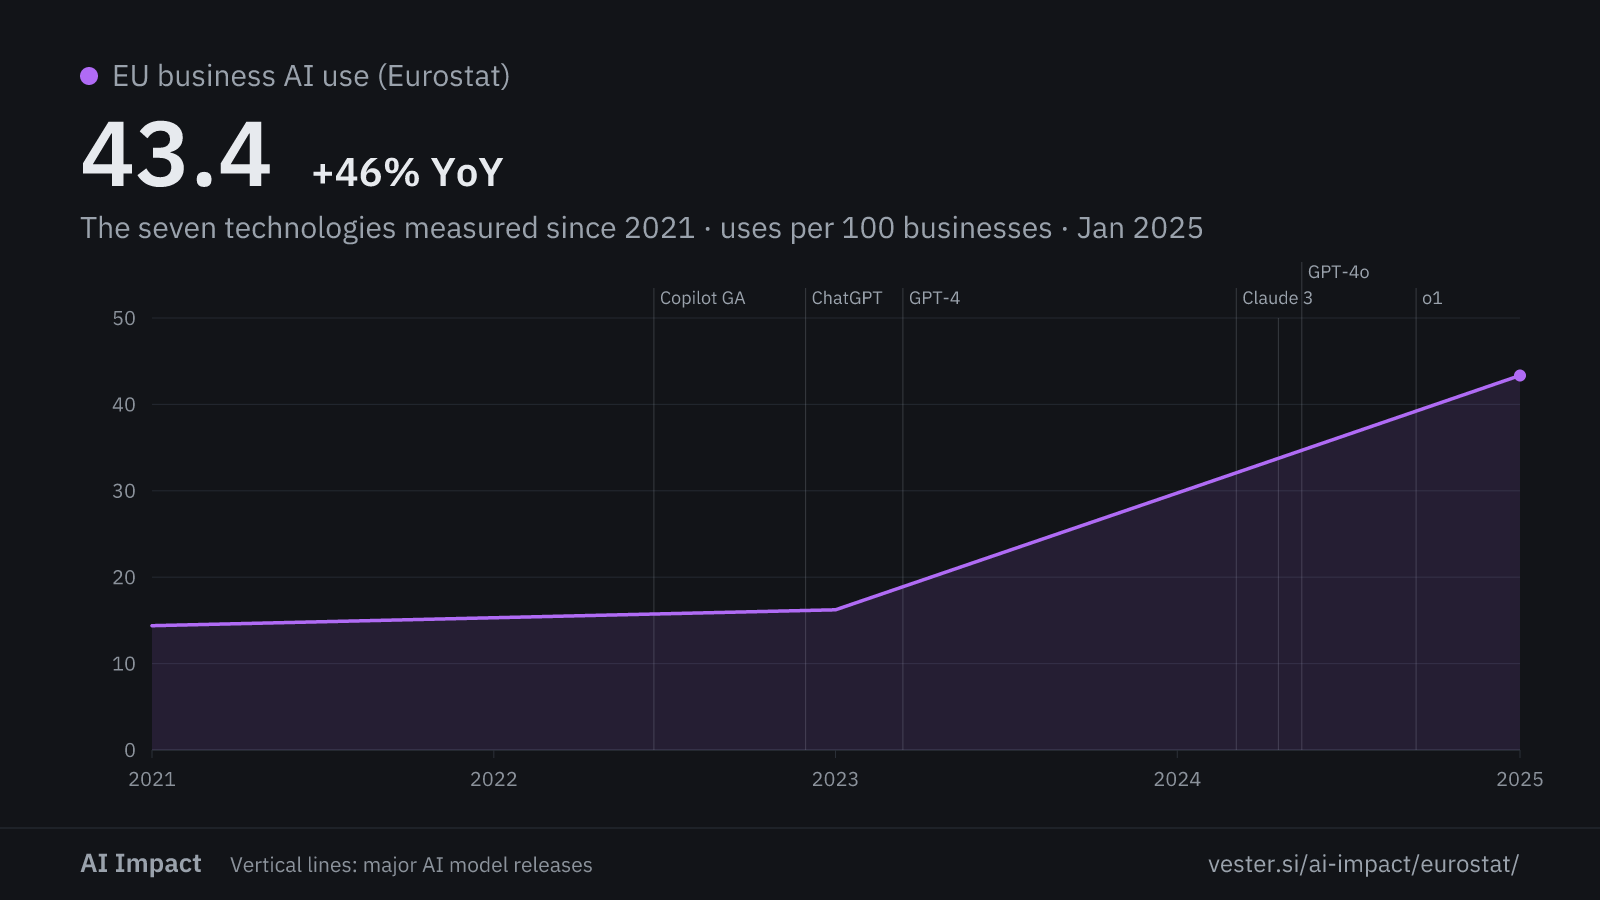
The seven technologies measured since 2021 derived
By country
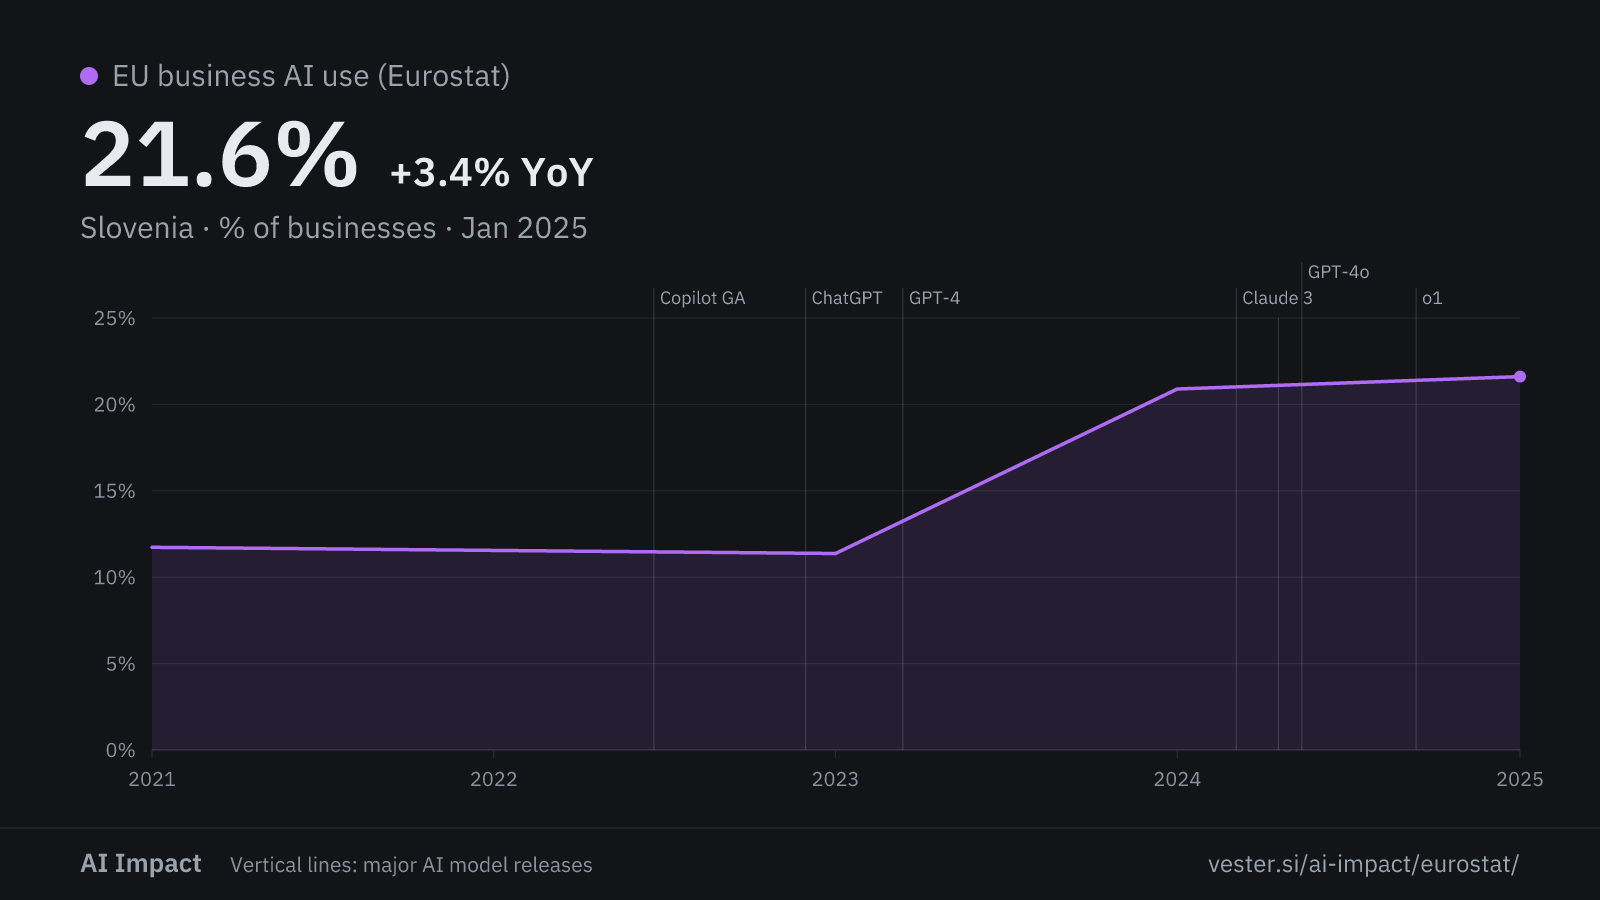
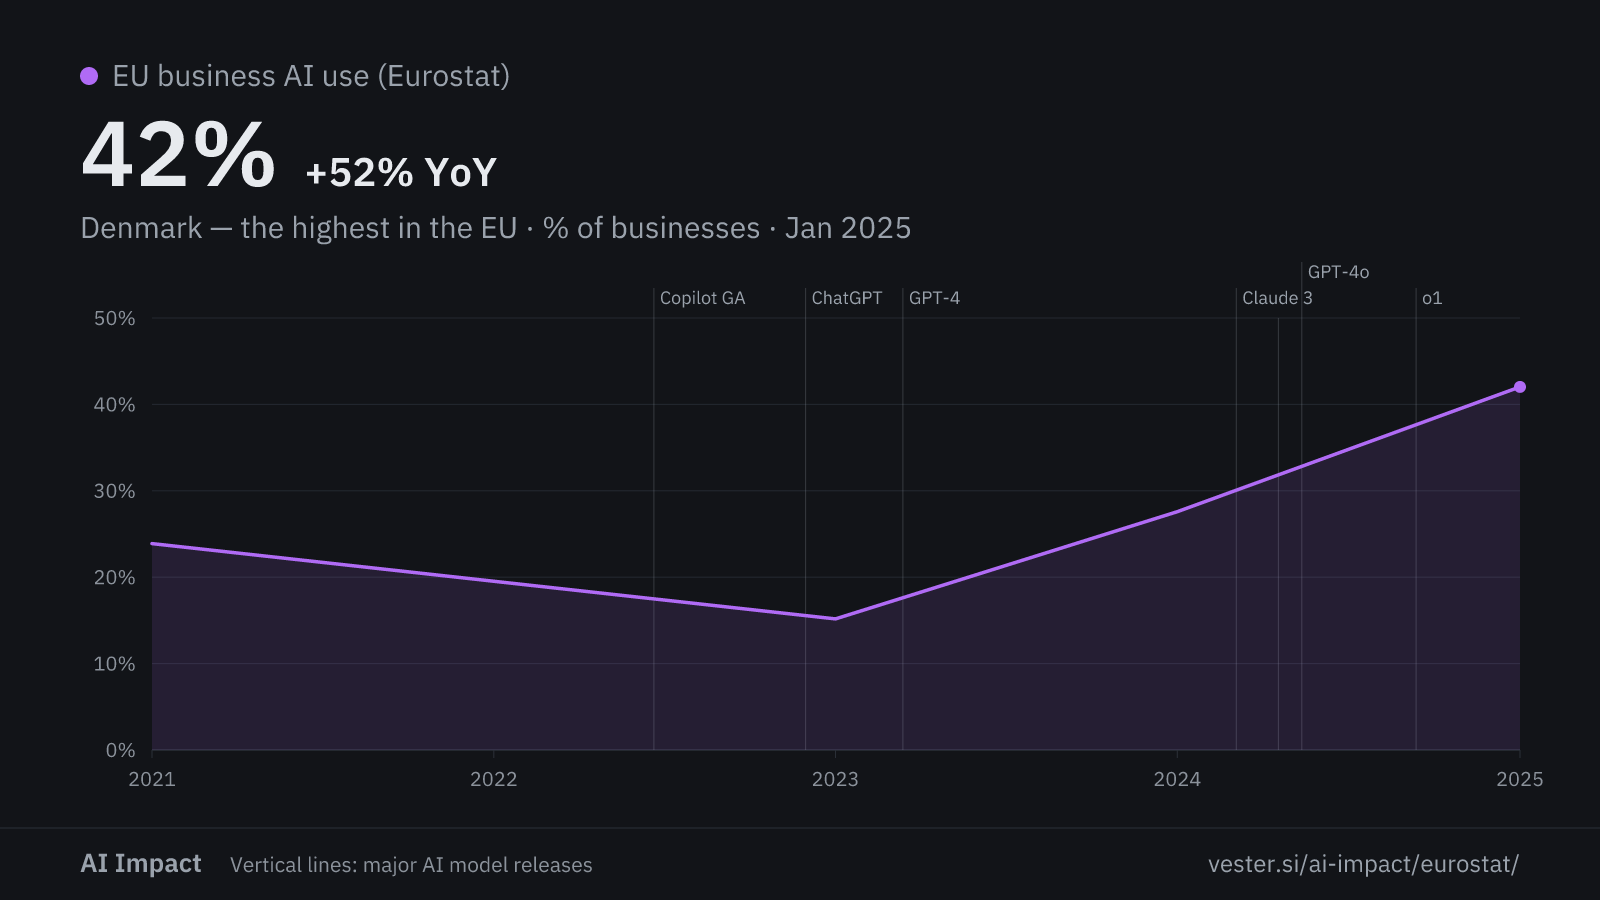
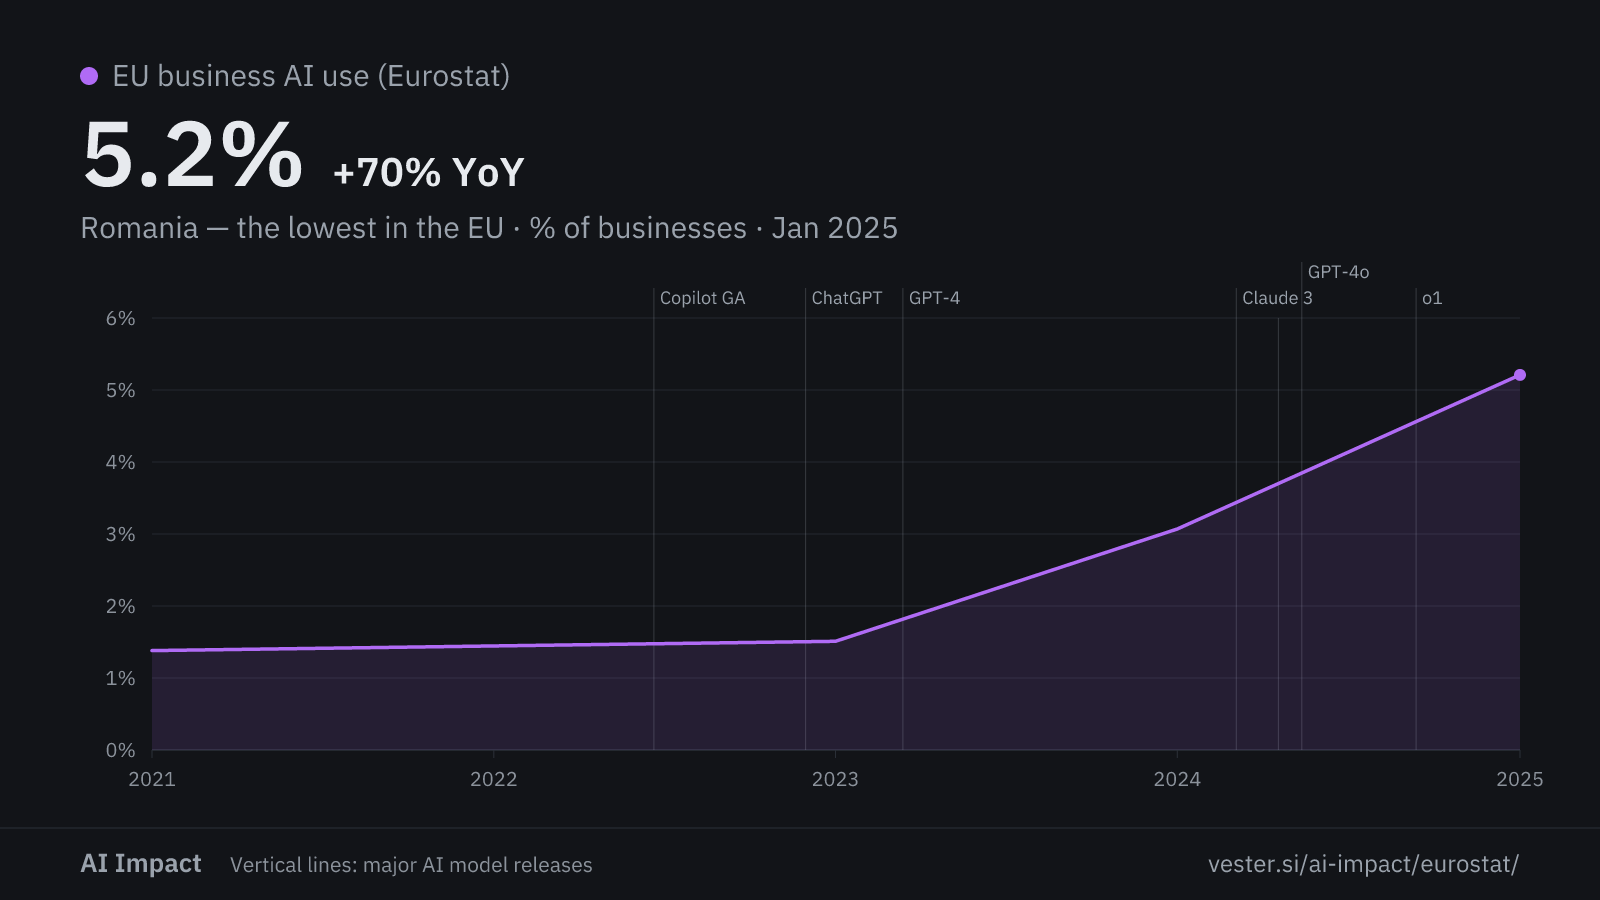
⚠ Do not compare 2021 with the later years. Eurostat marks a change in the survey at 2023, and Denmark drops from 24% to 15%.
EU businesses using AI (2025 adds one technology)
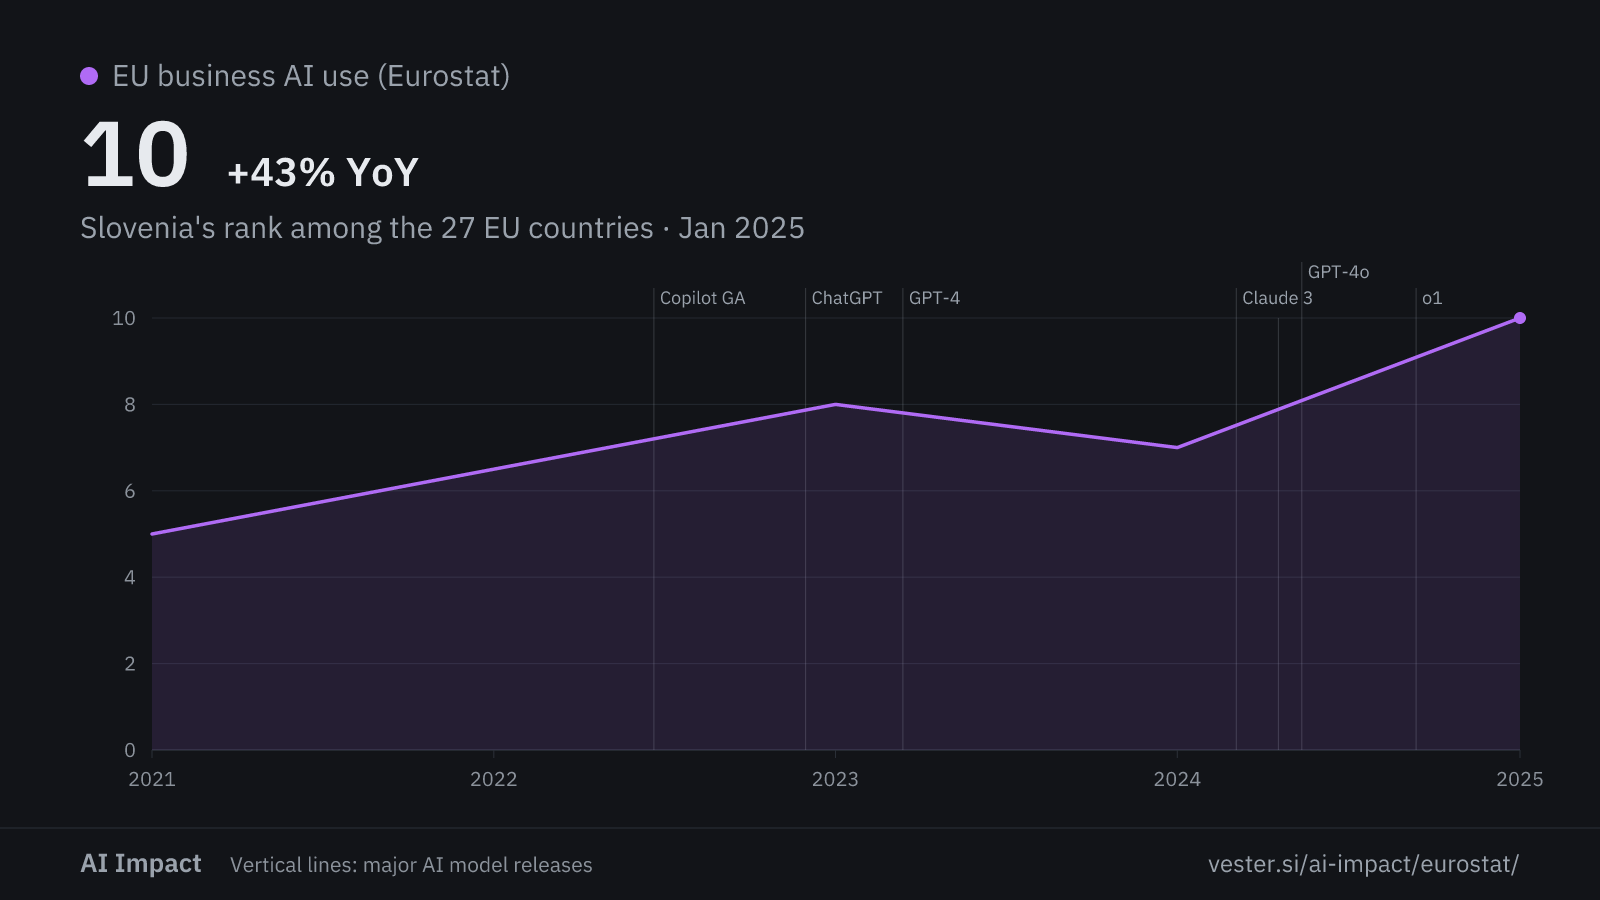
Slovenia
Denmark — the highest in the EU
Romania — the lowest in the EU
Slovenia's rank among the 27 EU countries derived
By business size
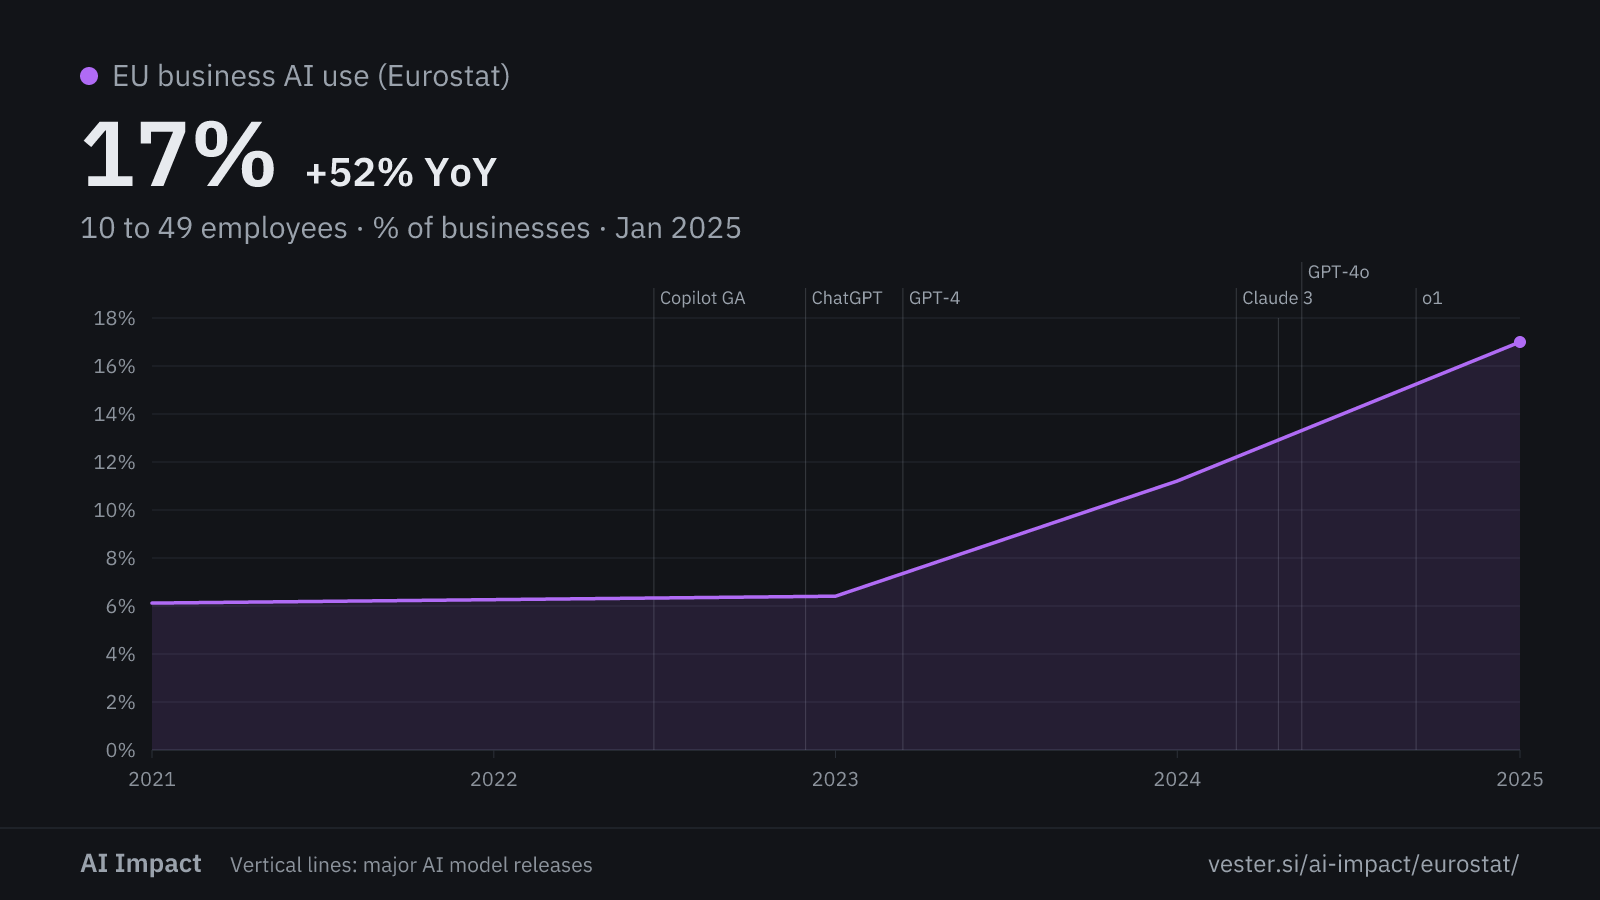
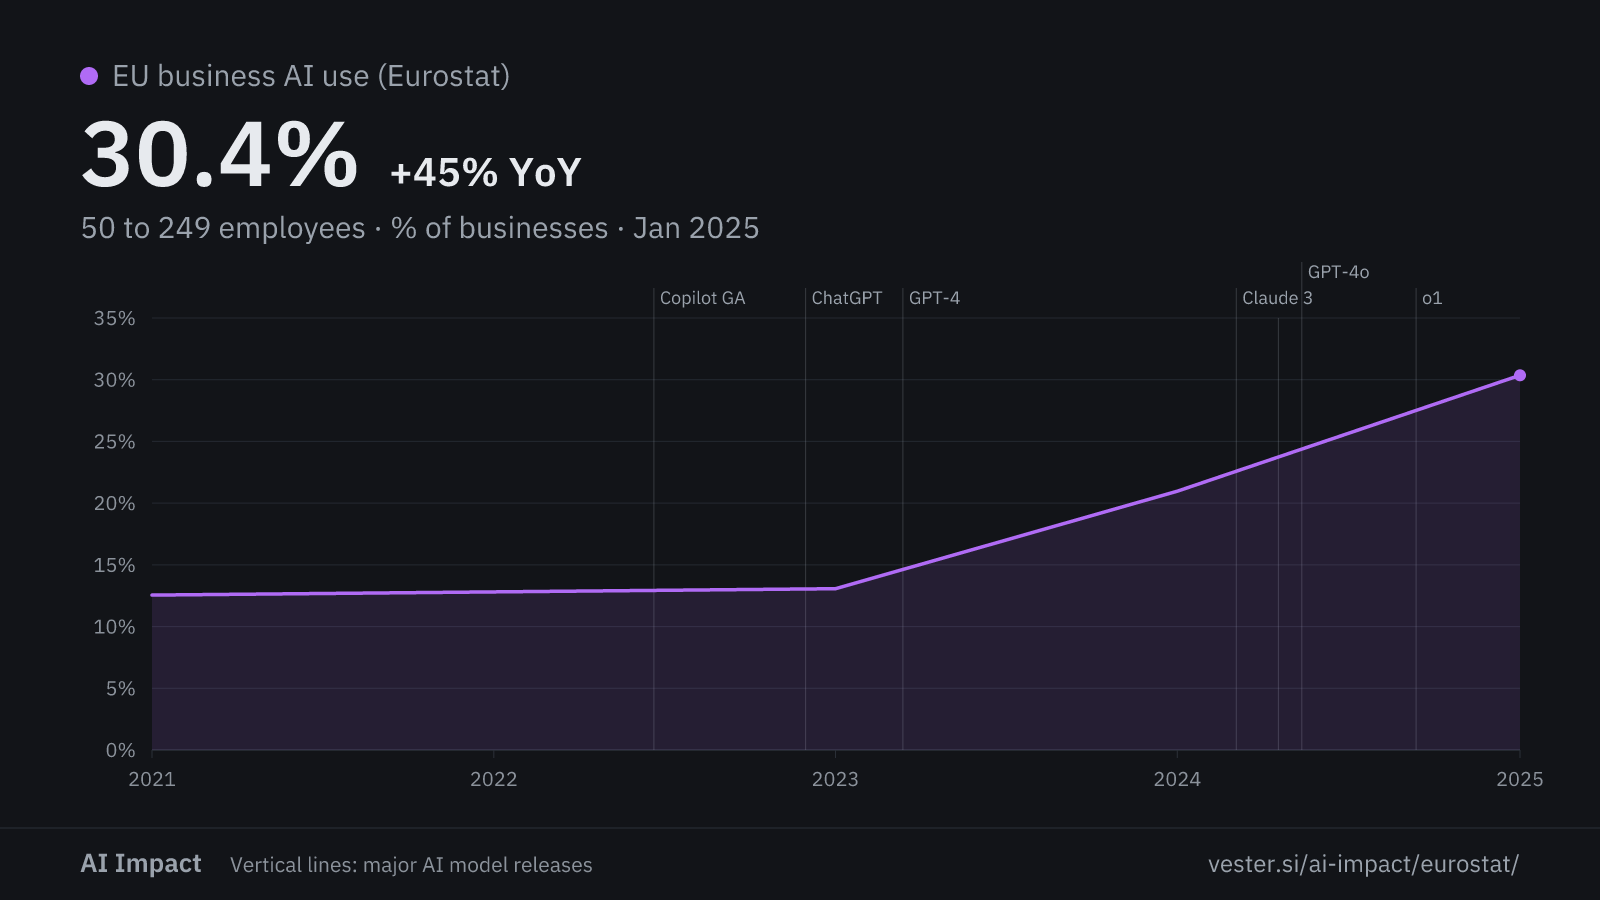
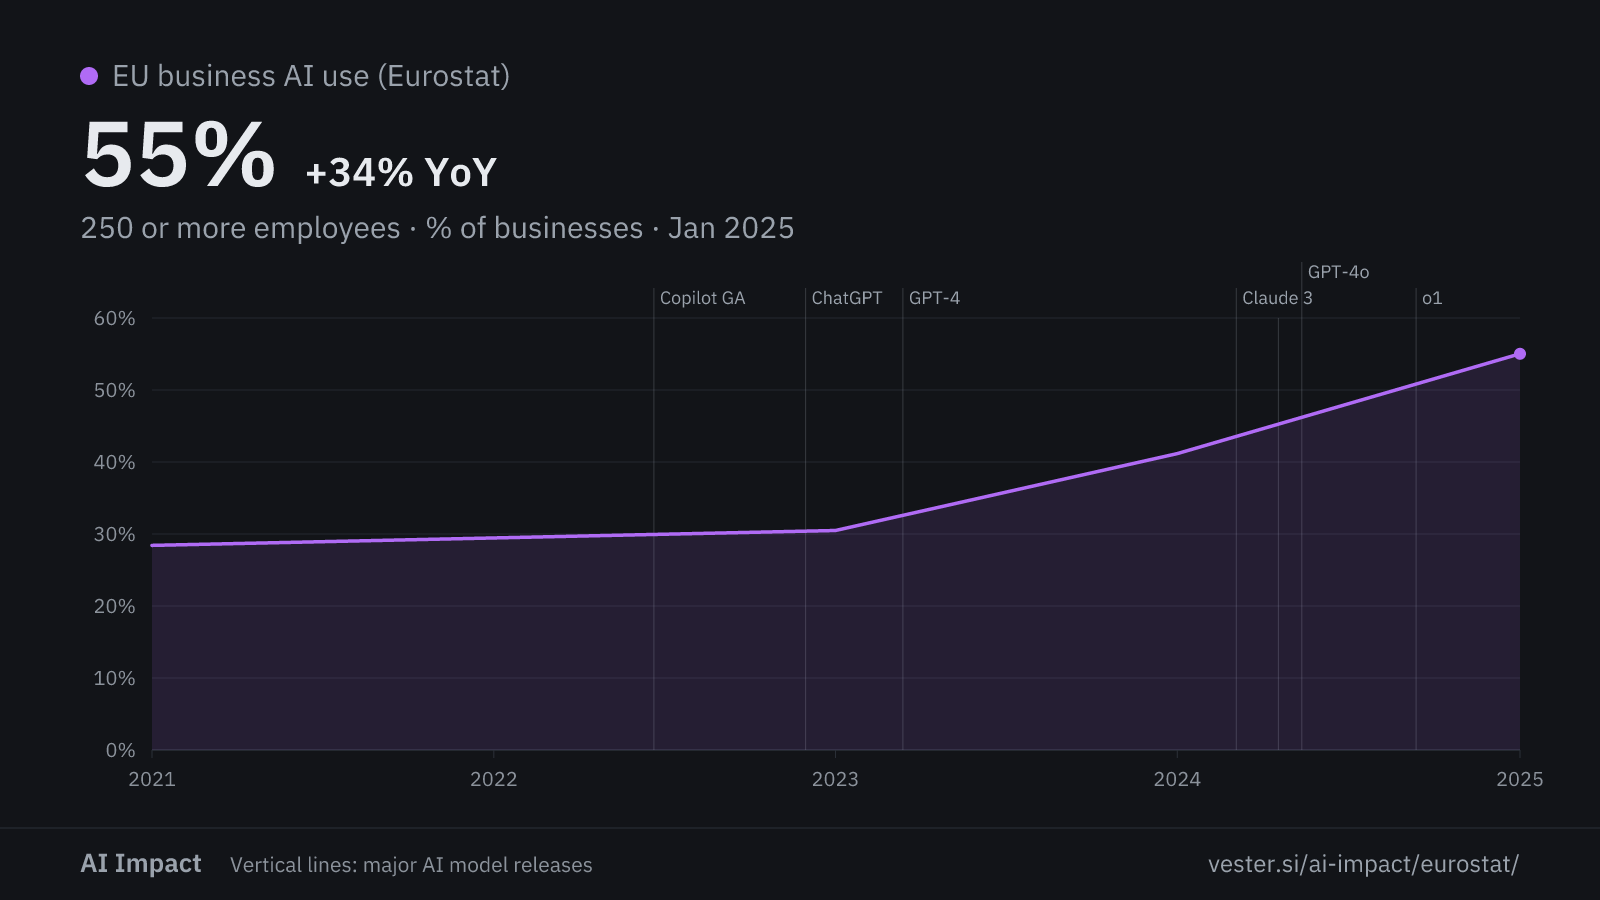
Eurostat measures the whole EU here. It does not survey businesses with fewer than 10 employees, so the smallest businesses are absent.
snapshots · collecting daily
These start accruing from first fetch — a curve builds over the coming days.
Figures
| Series | Latest | Change | Min | Max | Coverage |
|---|---|---|---|---|---|
| Text mining | 11.8% | +70.8% yr | 2.5% | 11.8% | Jan 2021 — Jan 2025 |
| Language or code generation | 8.8% | +61.9% yr | 1.3% | 8.8% | Jan 2021 — Jan 2025 |
| Speech recognition | 7.2% | +51.0% yr | 2.3% | 7.2% | Jan 2021 — Jan 2025 |
| Machine learning for data analysis | 5.1% | +20.3% yr | 2.4% | 5.1% | Jan 2021 — Jan 2025 |
| Workflow automation | 5.3% | +27.7% yr | 2.9% | 5.3% | Jan 2021 — Jan 2025 |
| Image recognition | 3.8% | +17.0% yr | 2.1% | 3.8% | Jan 2021 — Jan 2025 |
| Autonomous robots and vehicles | 1.4% | +37.6% yr | 0.89% | 1.4% | Jan 2021 — Jan 2025 |
| Image, video and audio generation | 9.6% | — | 9.6% | 9.6% | Jan 2025 — Jan 2025 |
| EU businesses using AI (2025 adds one technology) | 19.9% | +48.0% yr | 7.7% | 19.9% | Jan 2021 — Jan 2025 |
| Slovenia | 21.6% | +3.4% yr | 11.4% | 21.6% | Jan 2021 — Jan 2025 |
| Denmark — the highest in the EU | 42.0% | +52.4% yr | 15.2% | 42.0% | Jan 2021 — Jan 2025 |
| Romania — the lowest in the EU | 5.2% | +69.7% yr | 1.4% | 5.2% | Jan 2021 — Jan 2025 |
| 10 to 49 employees | 17% | +51.7% yr | 6.1% | 17% | Jan 2021 — Jan 2025 |
| 50 to 249 employees | 30.4% | +44.8% yr | 12.6% | 30.4% | Jan 2021 — Jan 2025 |
| 250 or more employees | 55.0% | +33.7% yr | 28.4% | 55.0% | Jan 2021 — Jan 2025 |
| Slovenia's rank among the 27 EU countries | 10 | +42.9% yr | 5 | 10 | Jan 2021 — Jan 2025 |
| The seven technologies measured since 2021 | 43.4 | +45.8% yr | 14.4 | 43.4 | Jan 2021 — Jan 2025 |