US businesses (Census)
The share of US businesses that say they use AI, from the Census Bureau's Business Trends and Outlook Survey — a probability sample of about 1.2 million businesses, asked every two weeks since September 2023. Two questions are tracked (using AI now, and expecting to within six months), nationally and for eight sectors. This is the only source on this site that asks firms directly instead of inferring adoption from downloads, papers or traffic.
In November 2025 the Census changed the words of the question. Charts marked “earlier question” use the old words. Never join an old chart to a new one.
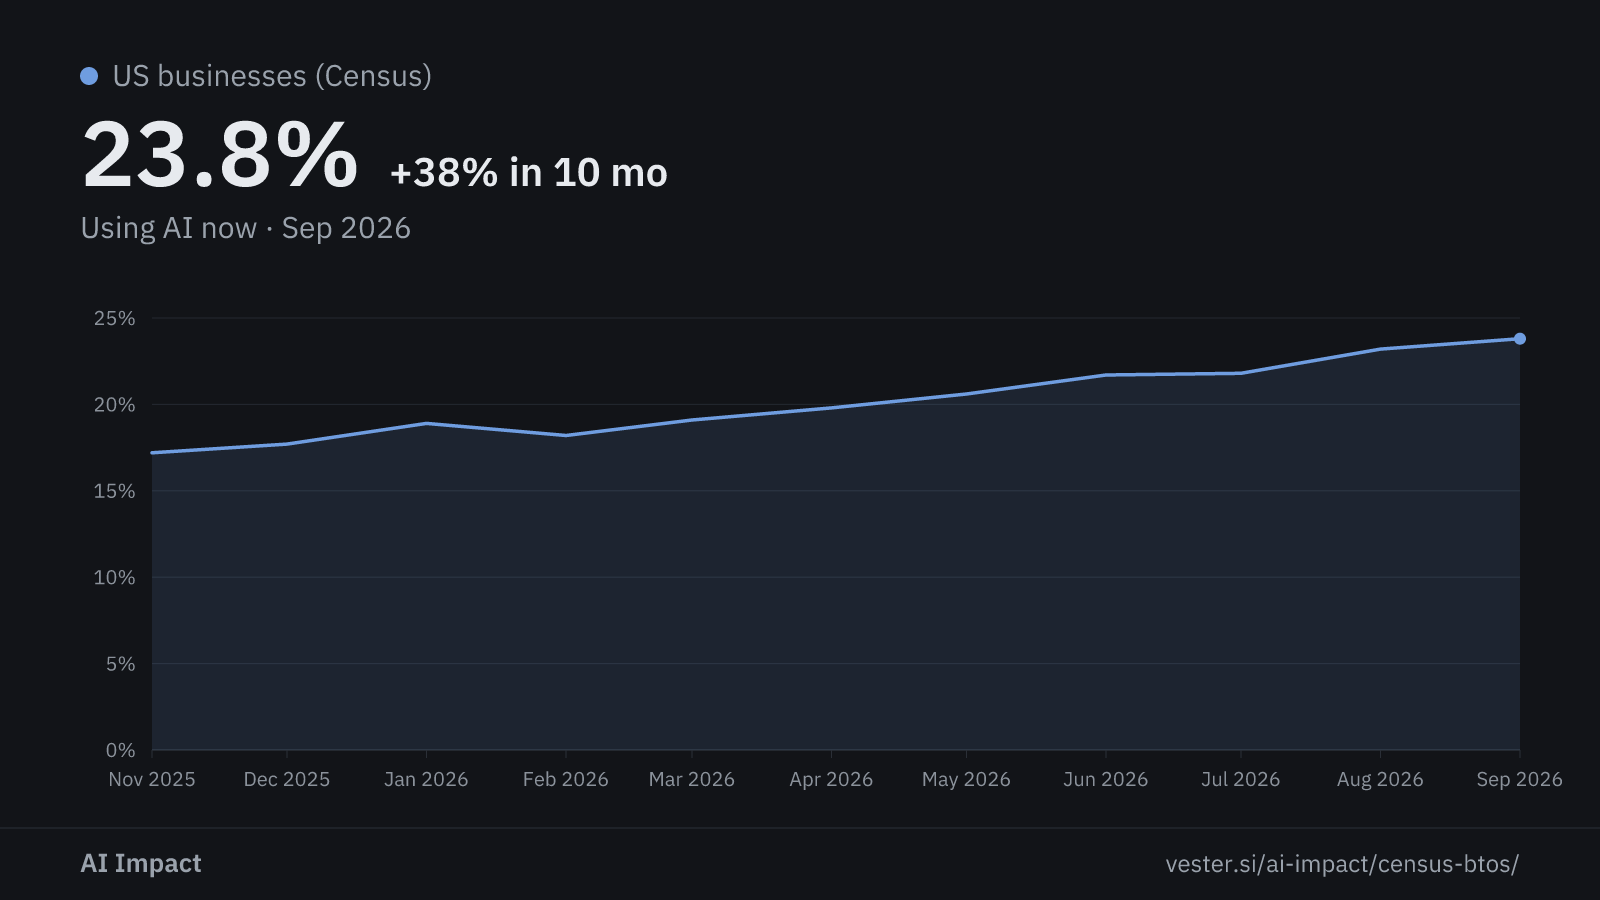
Nationwide
These charts start in November 2025. The US government shut down for six weeks before that, so October 2025 has no data.
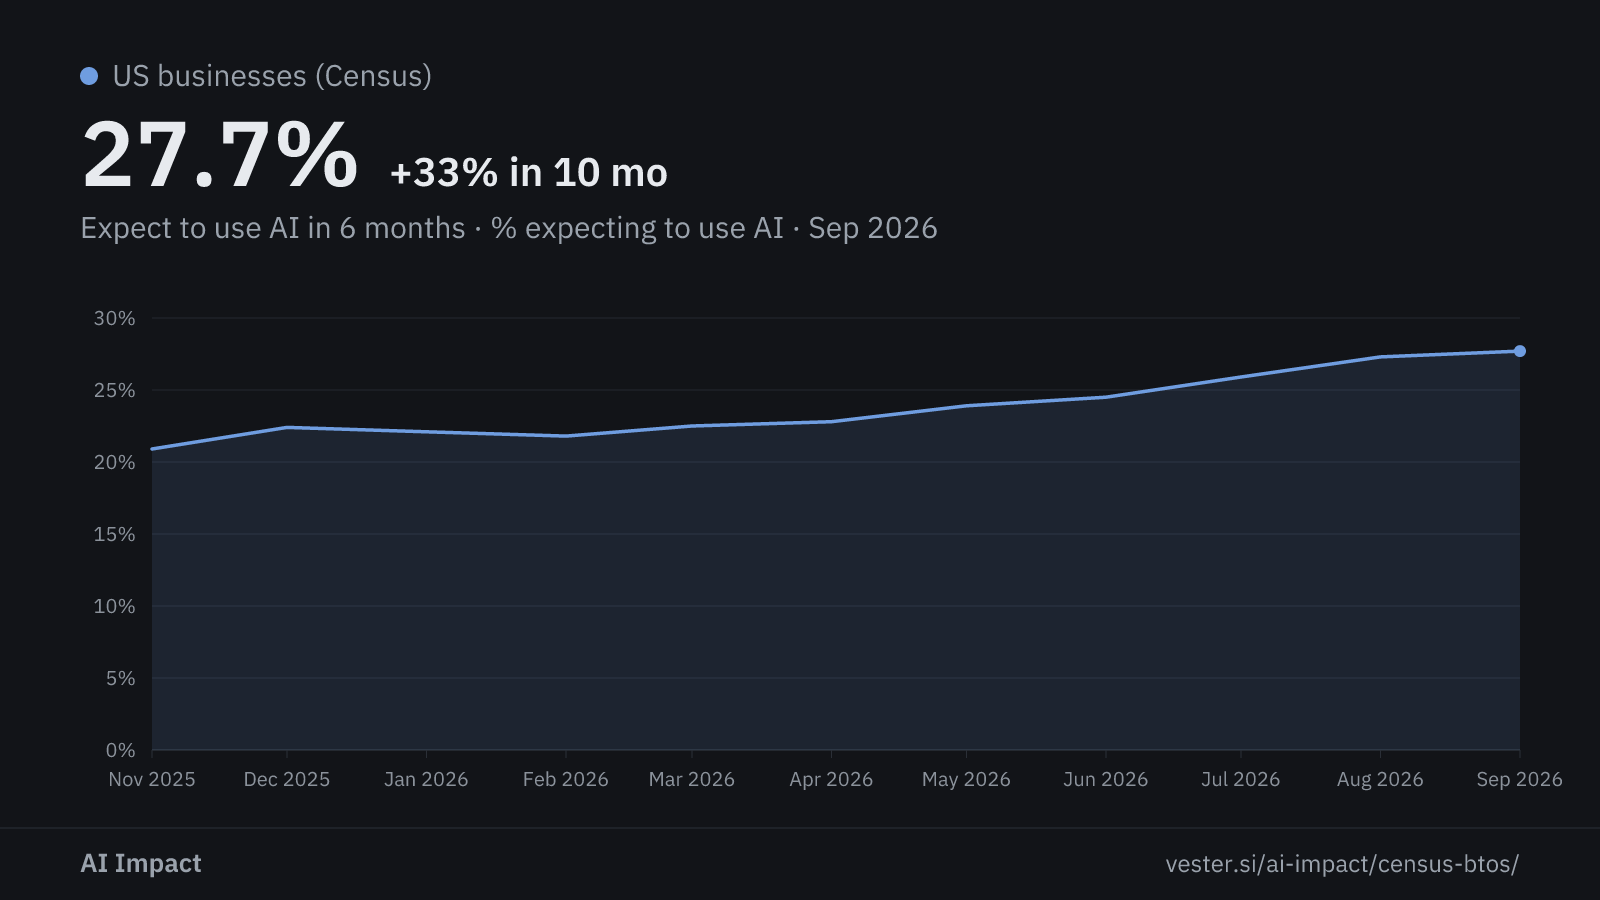
By sector
Each chart covers the businesses in one sector. The Census hides farming in almost every survey, so this page leaves it out.
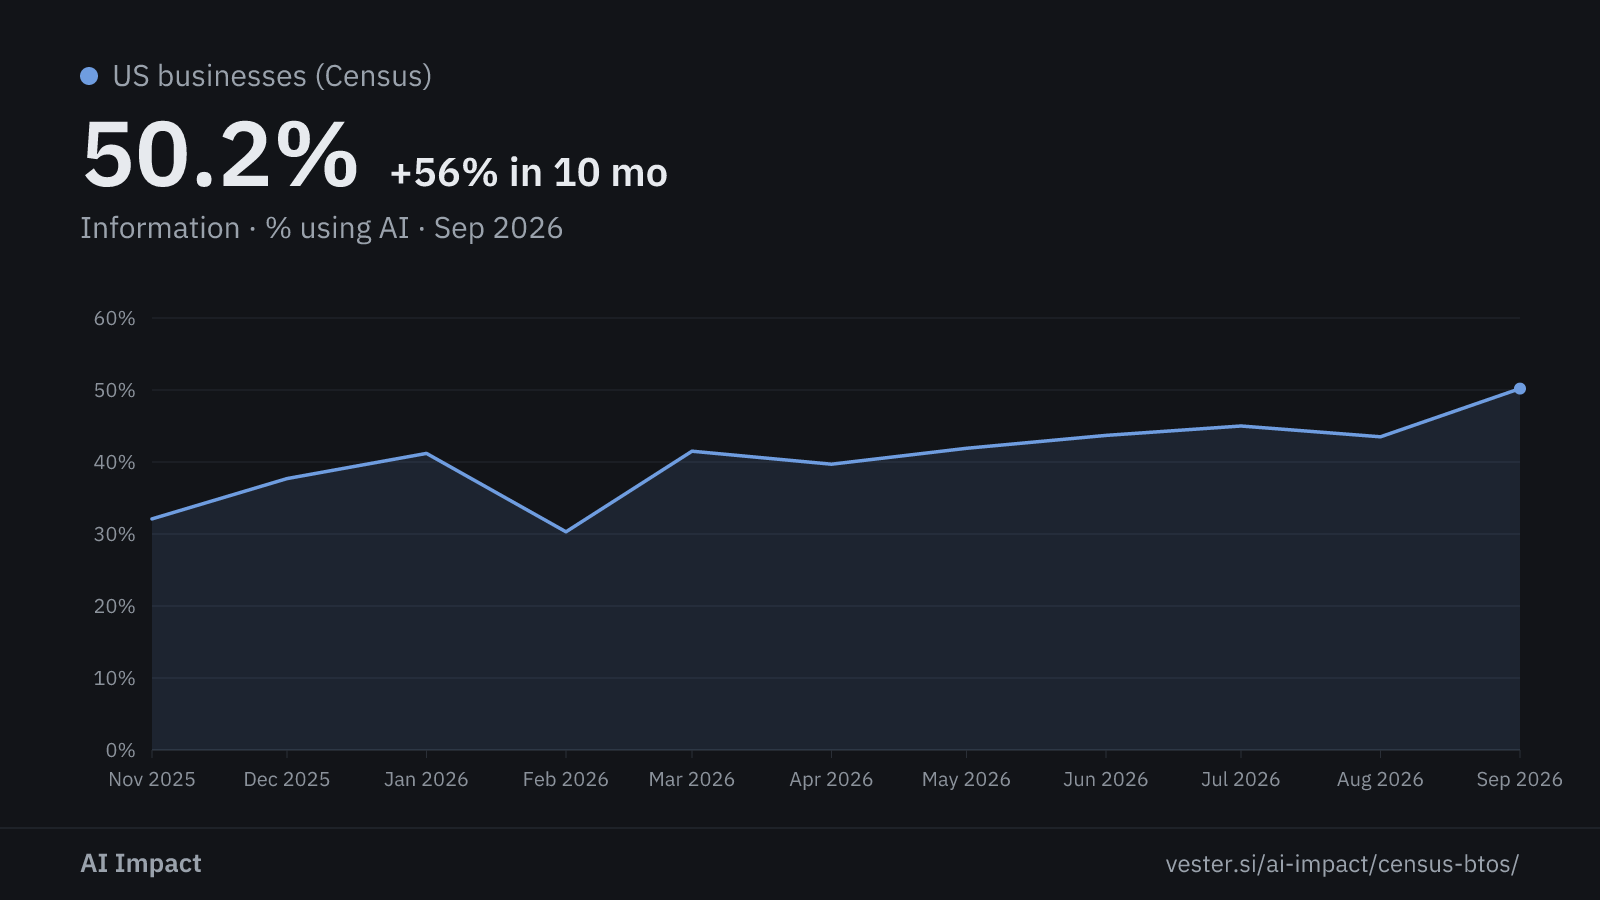
Information
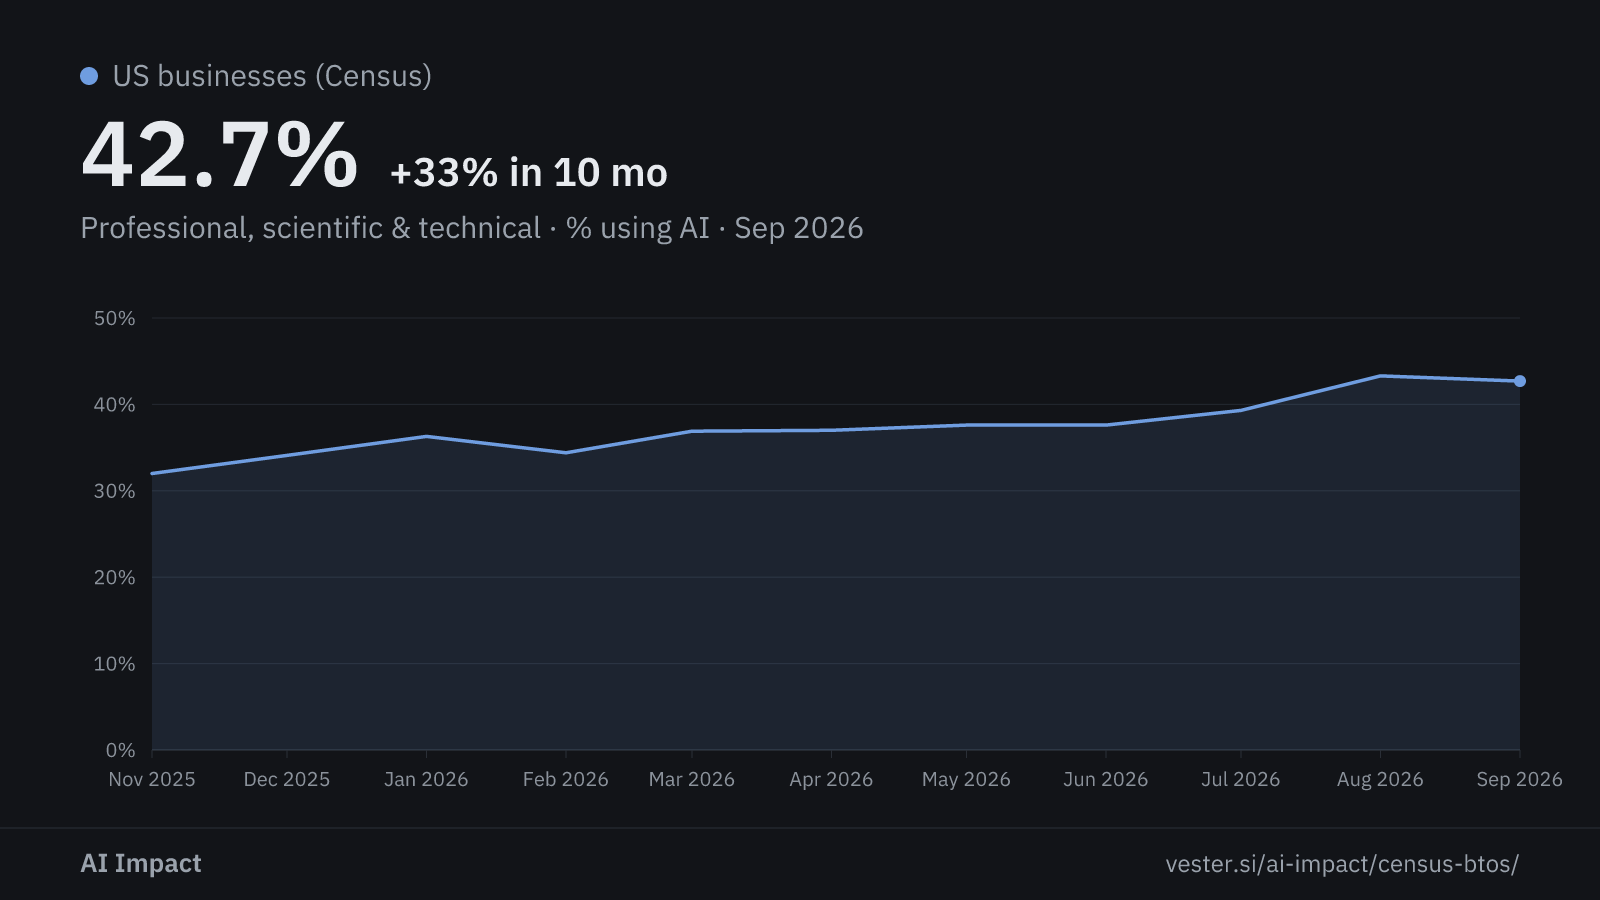
Professional, scientific & technical
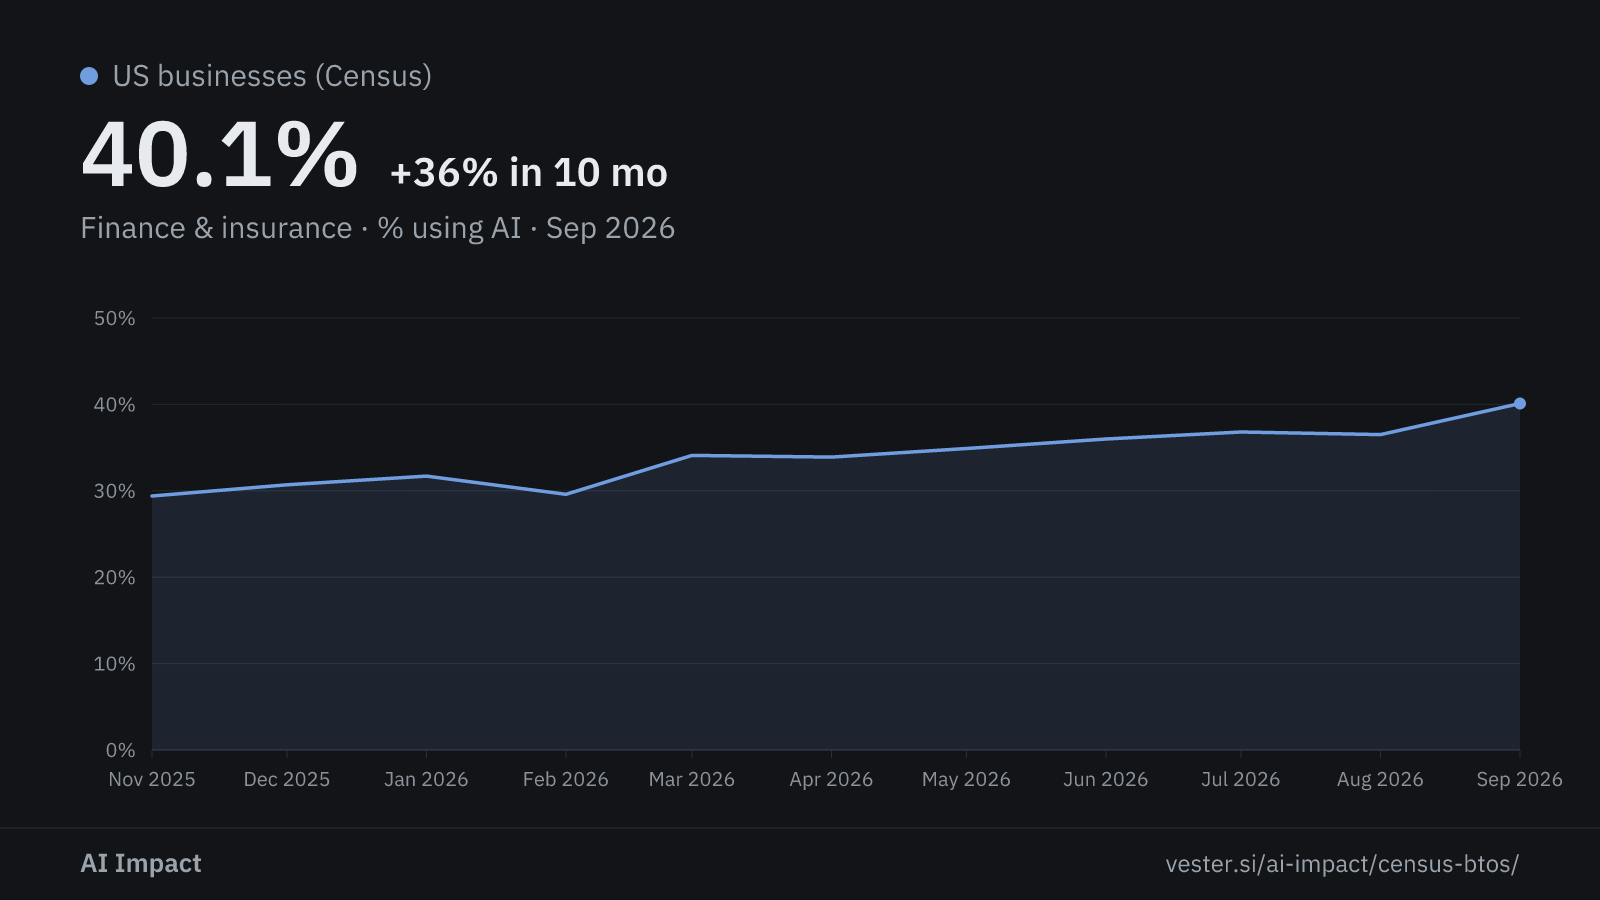
Finance & insurance
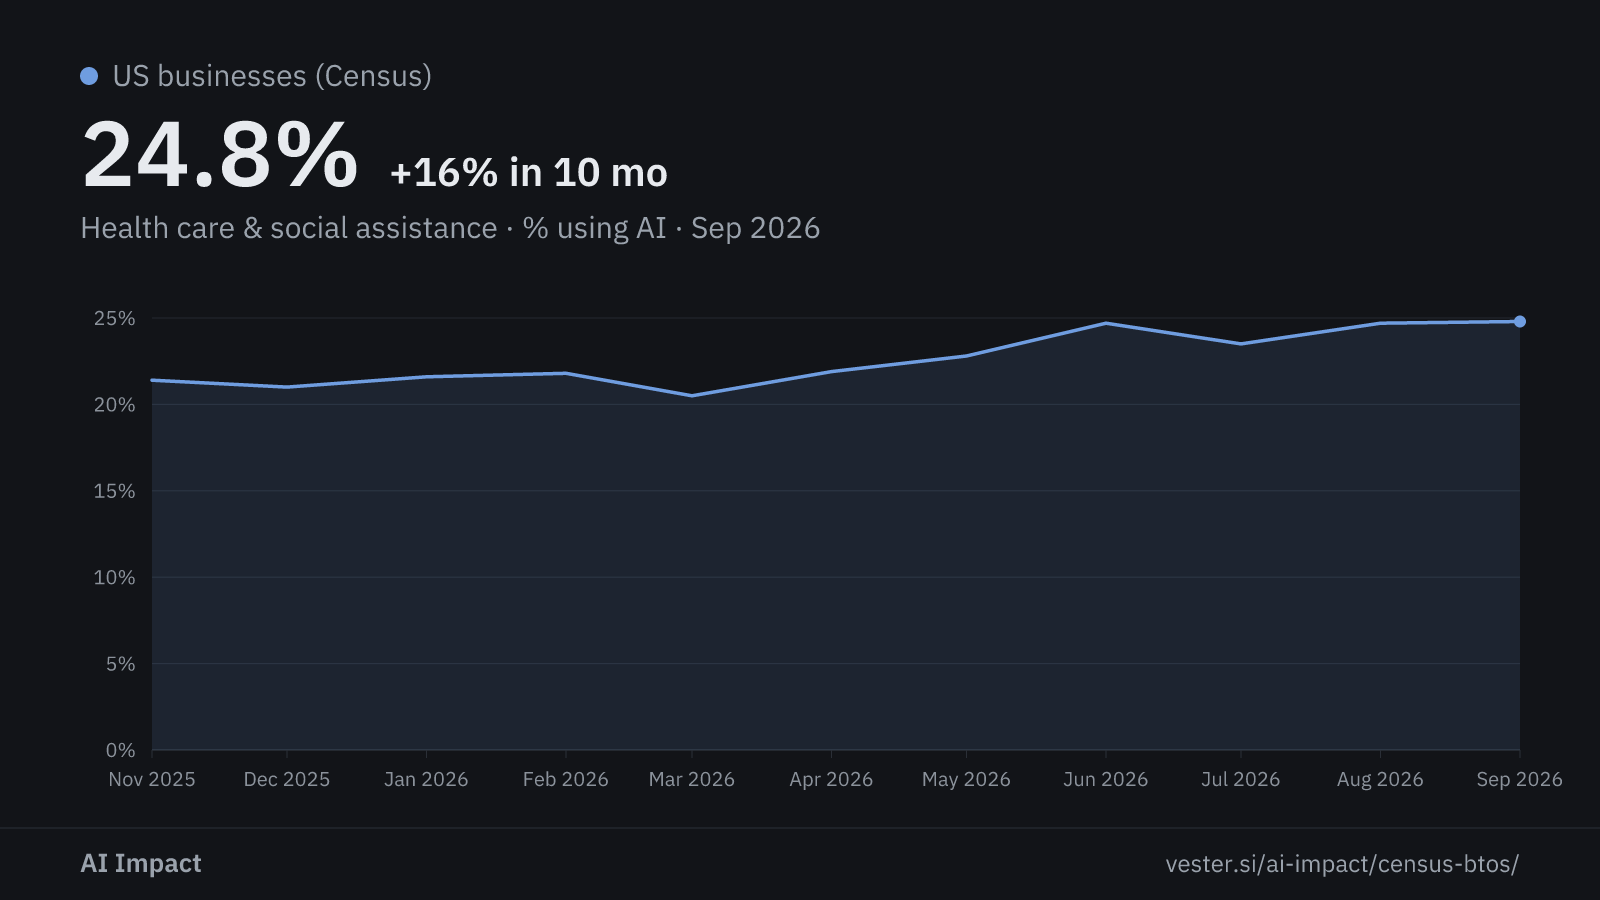
Health care & social assistance
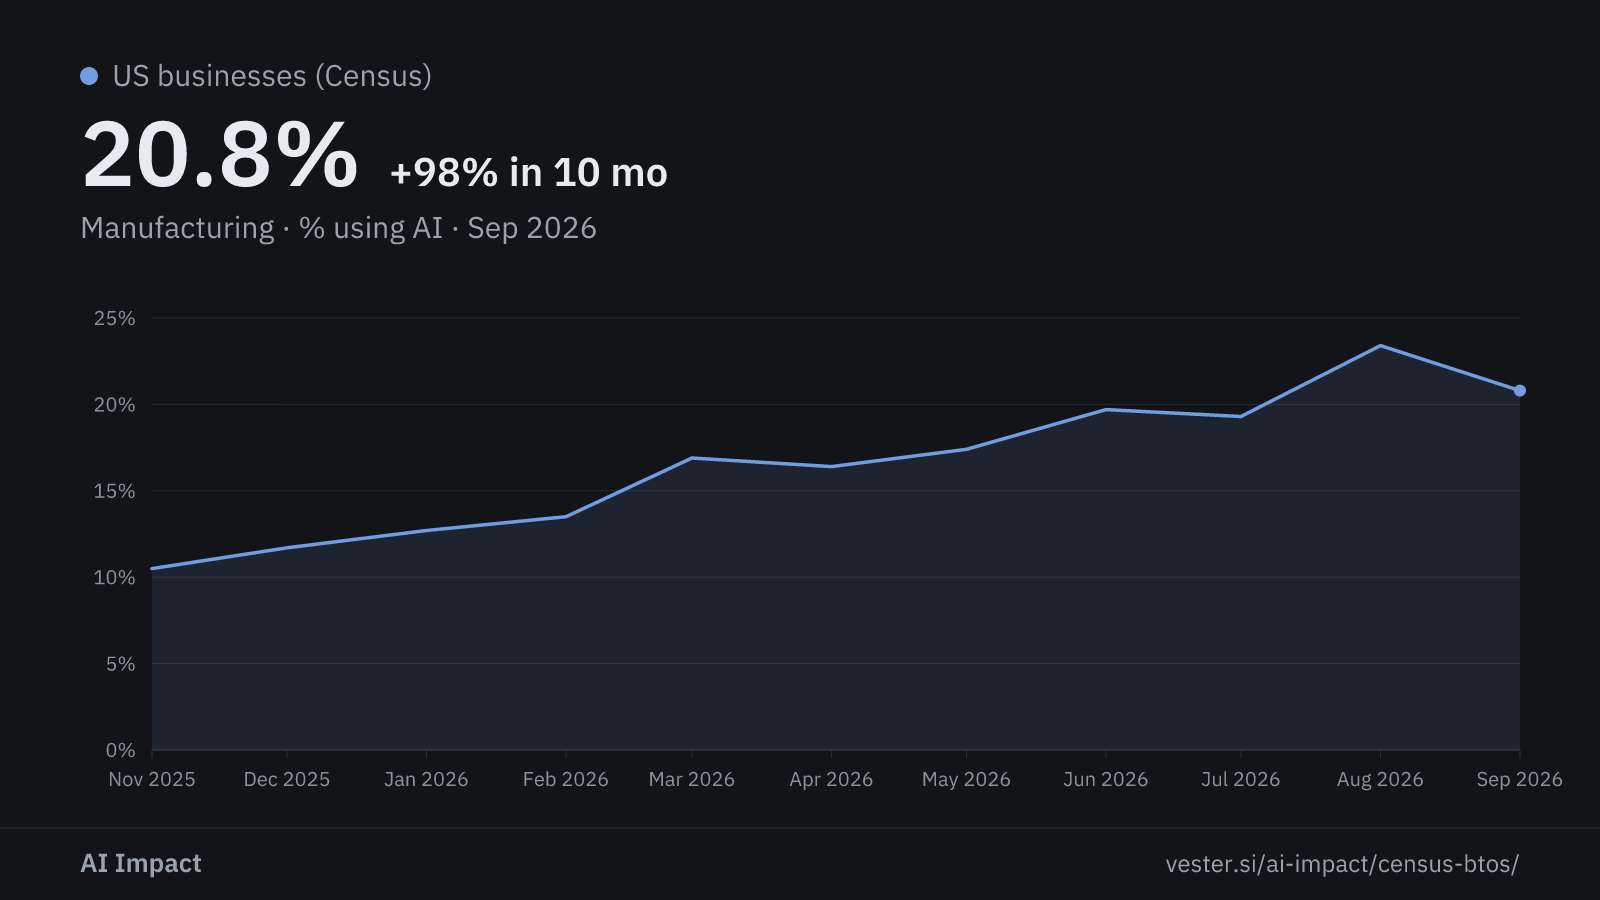
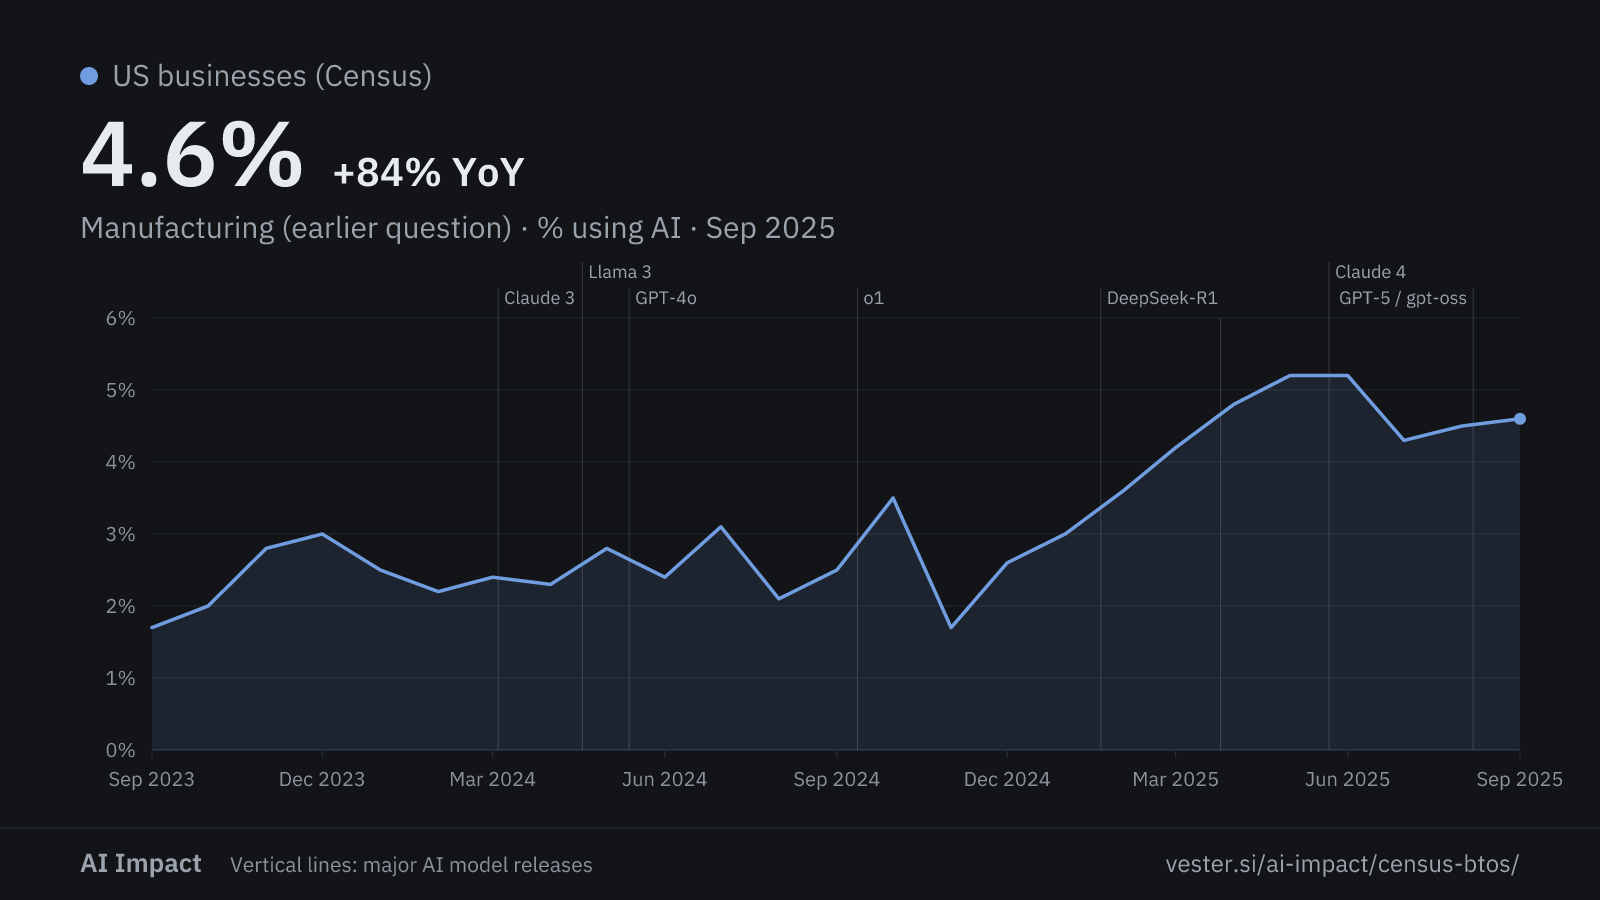
Manufacturing
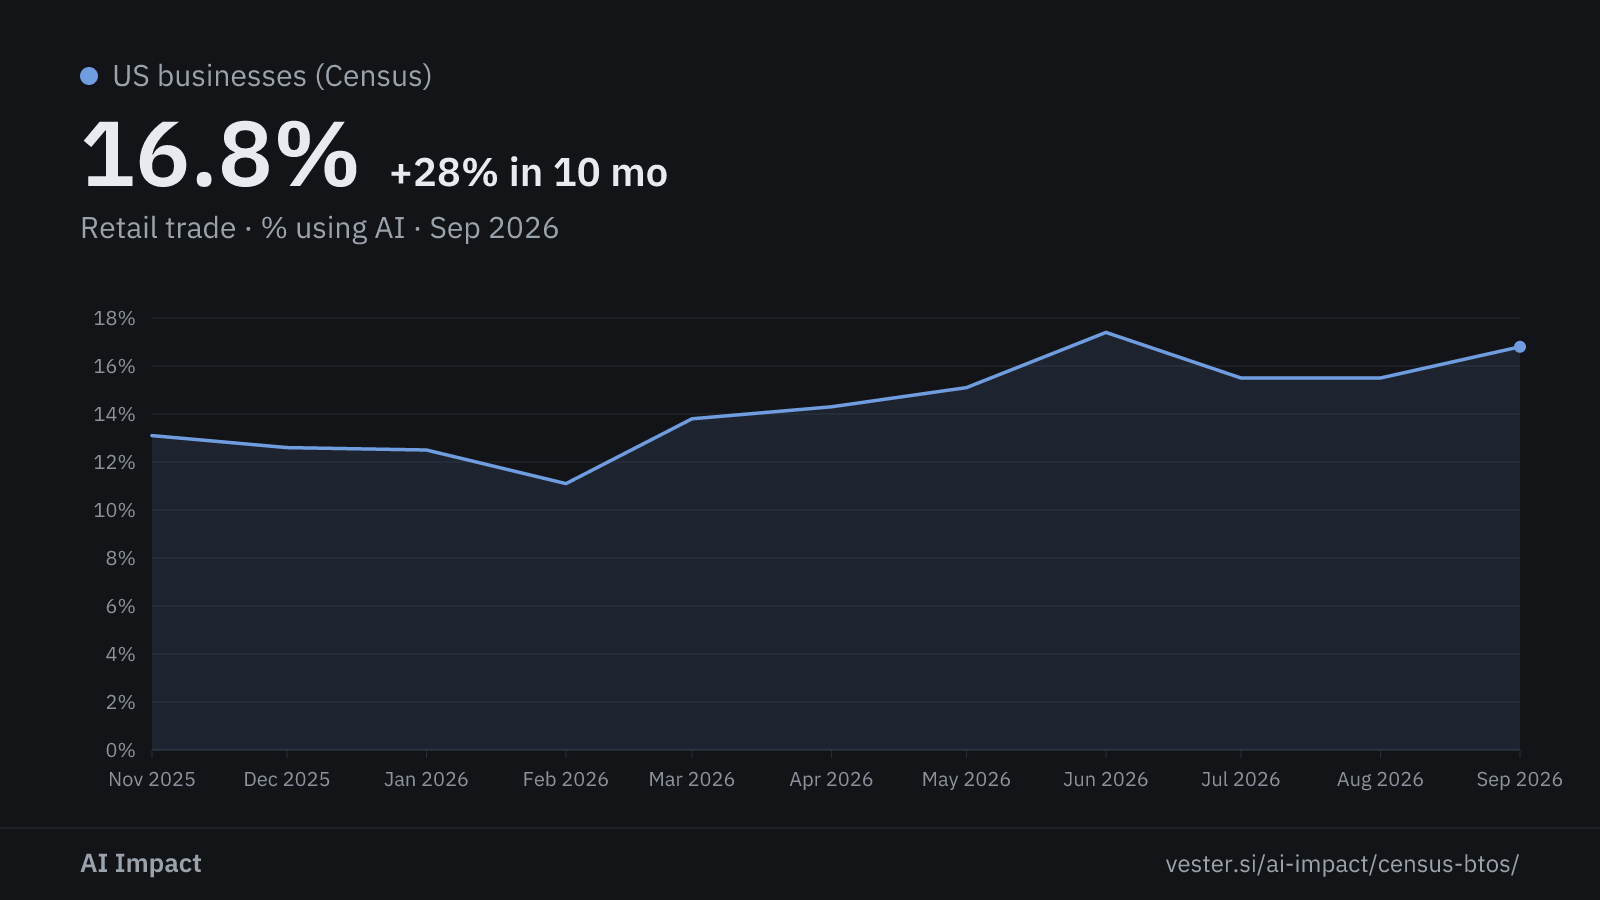
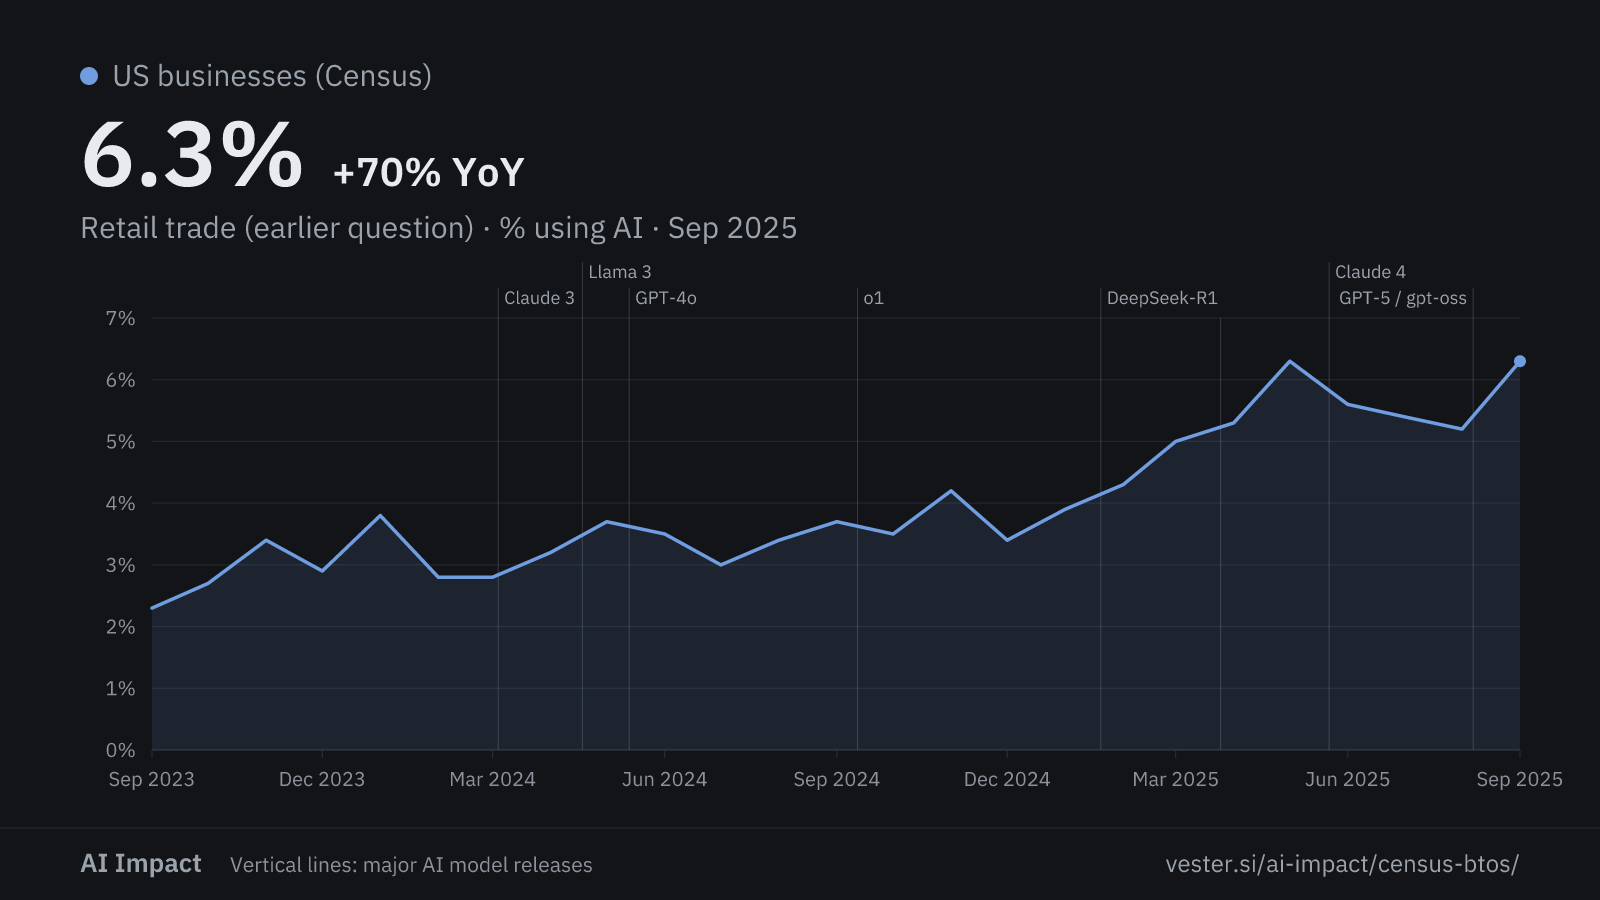
Retail trade
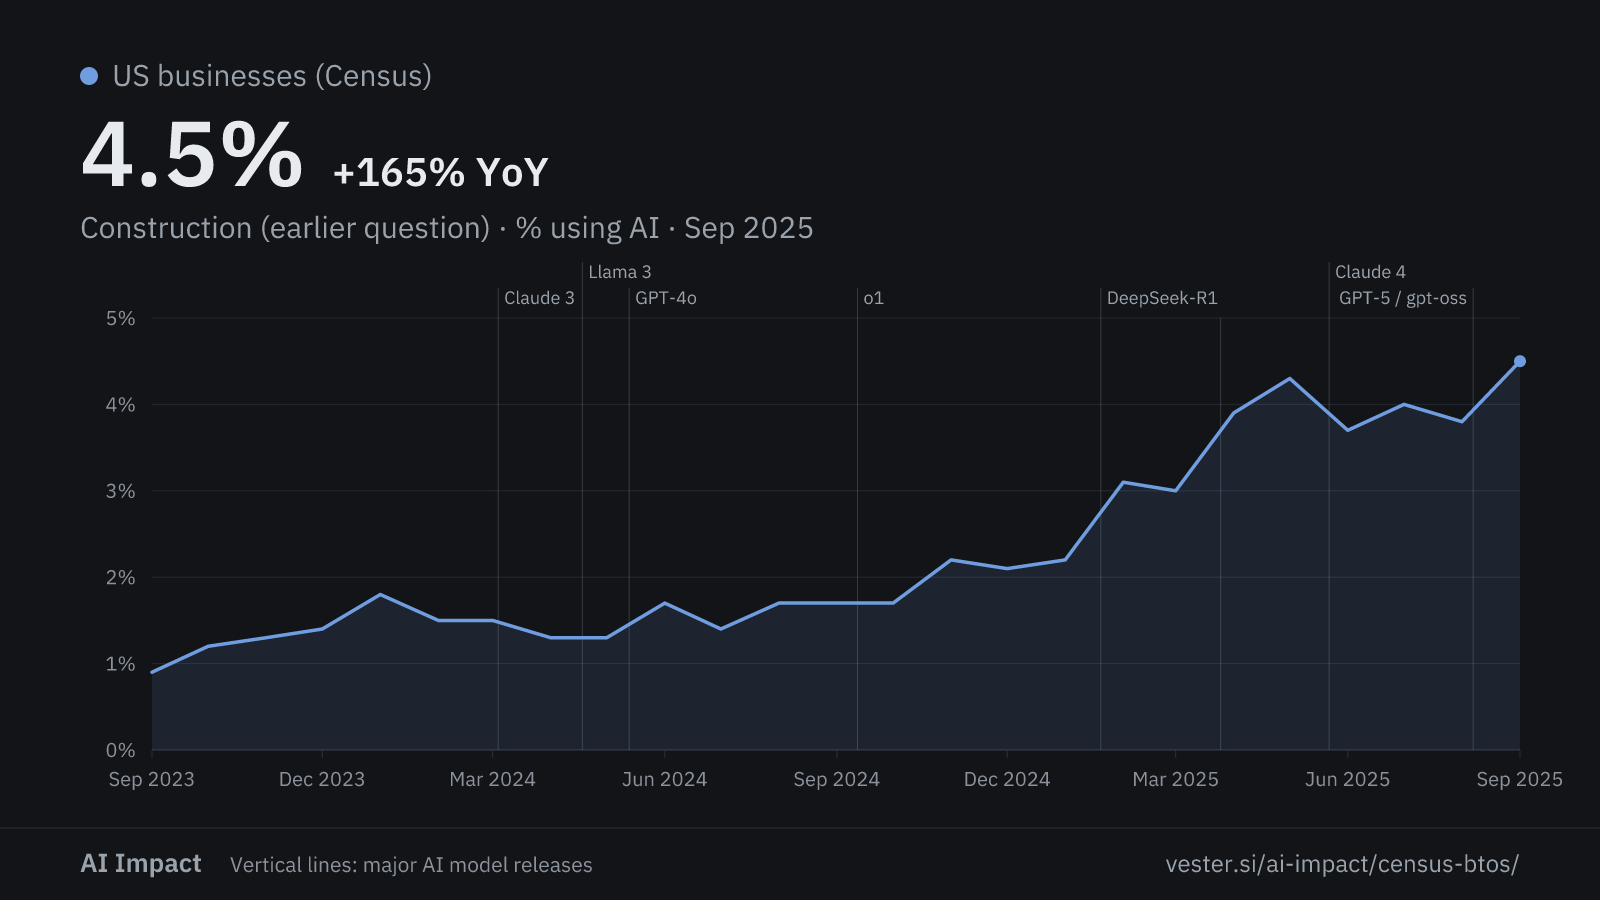
Construction
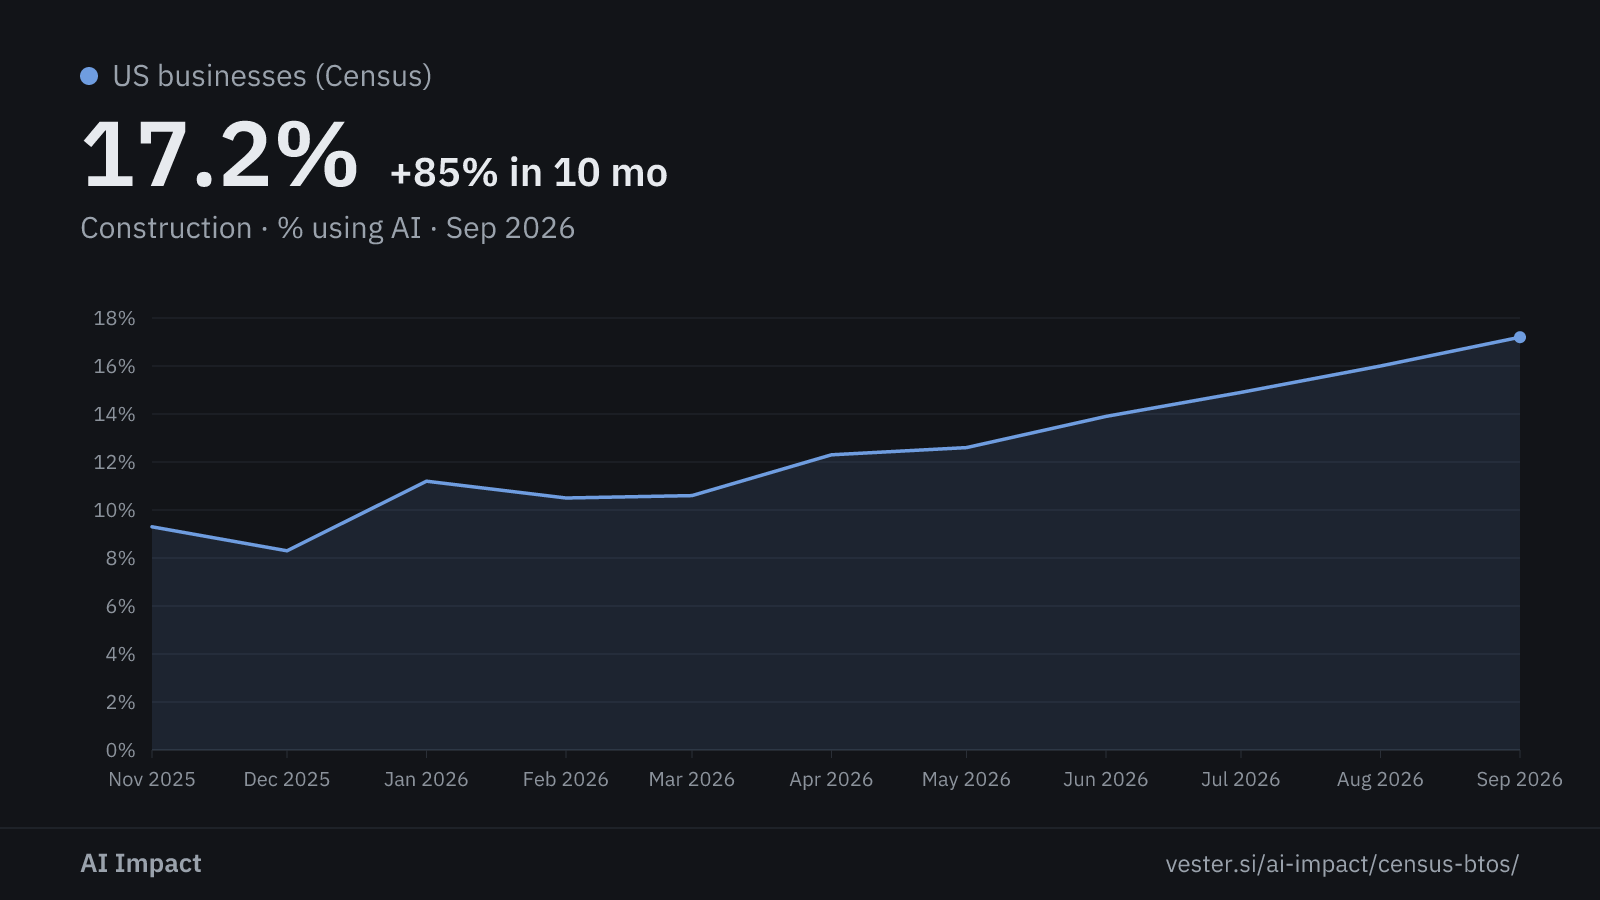
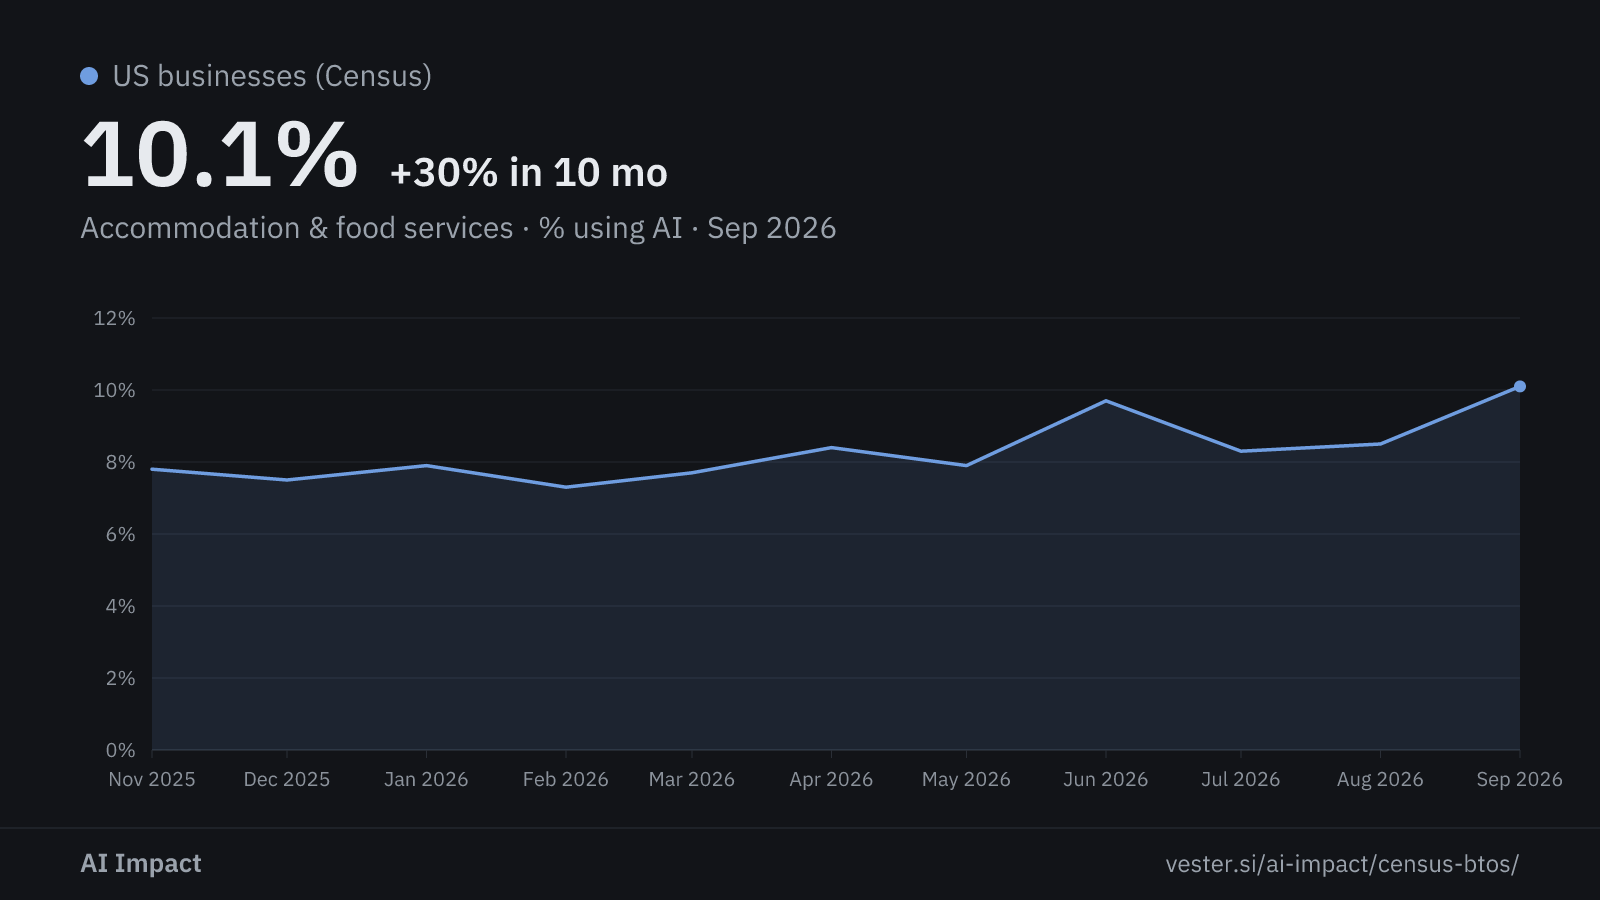
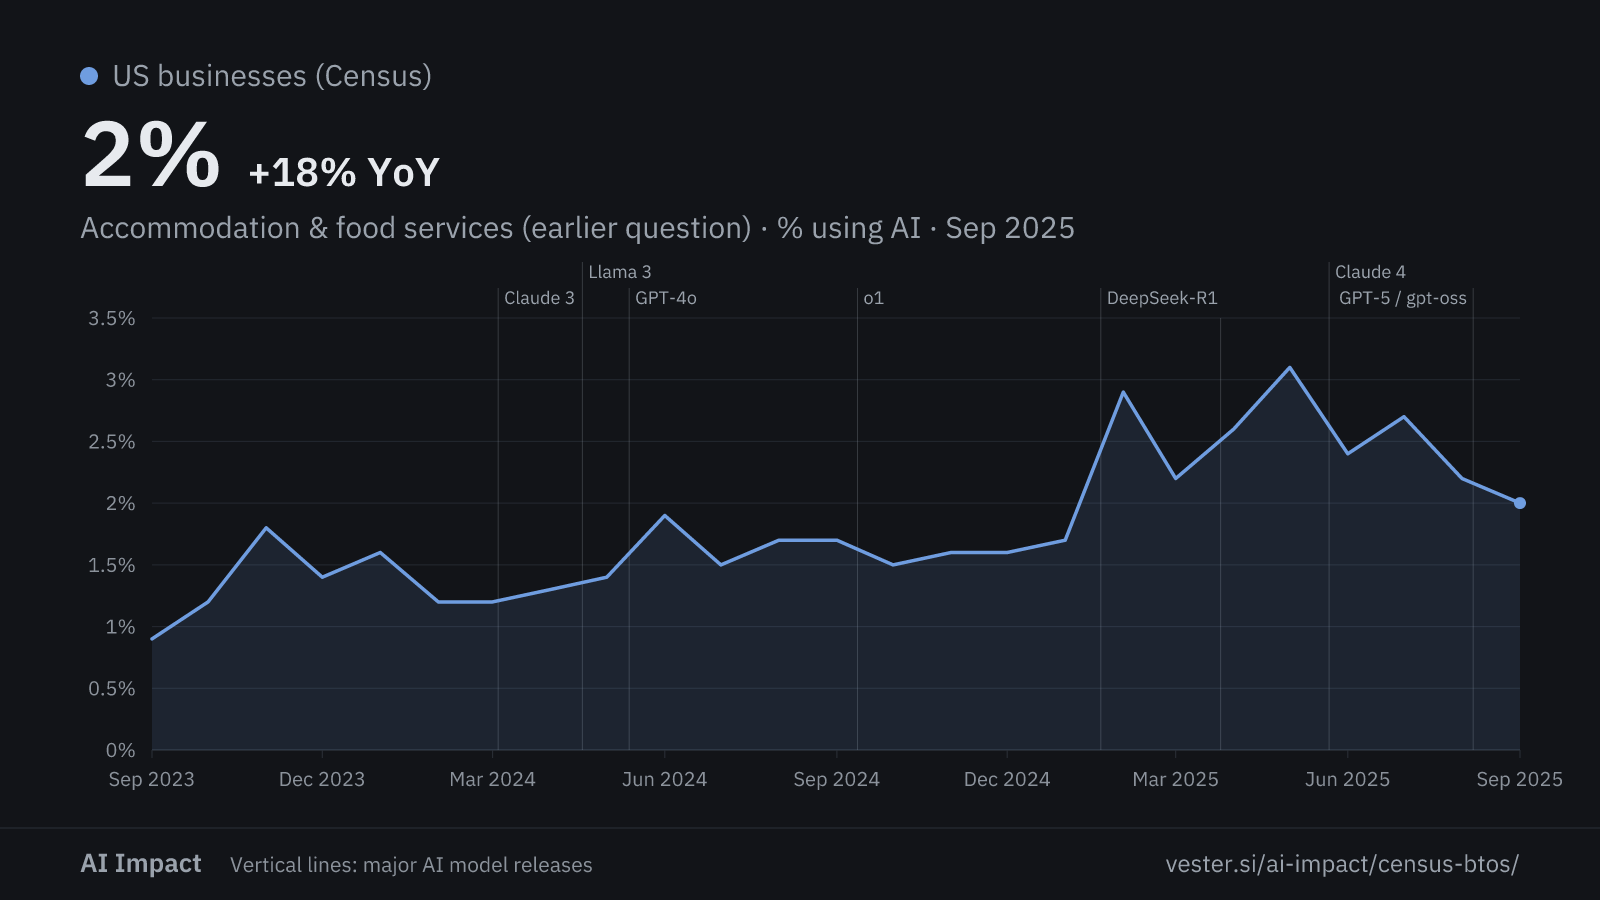
Accommodation & food services
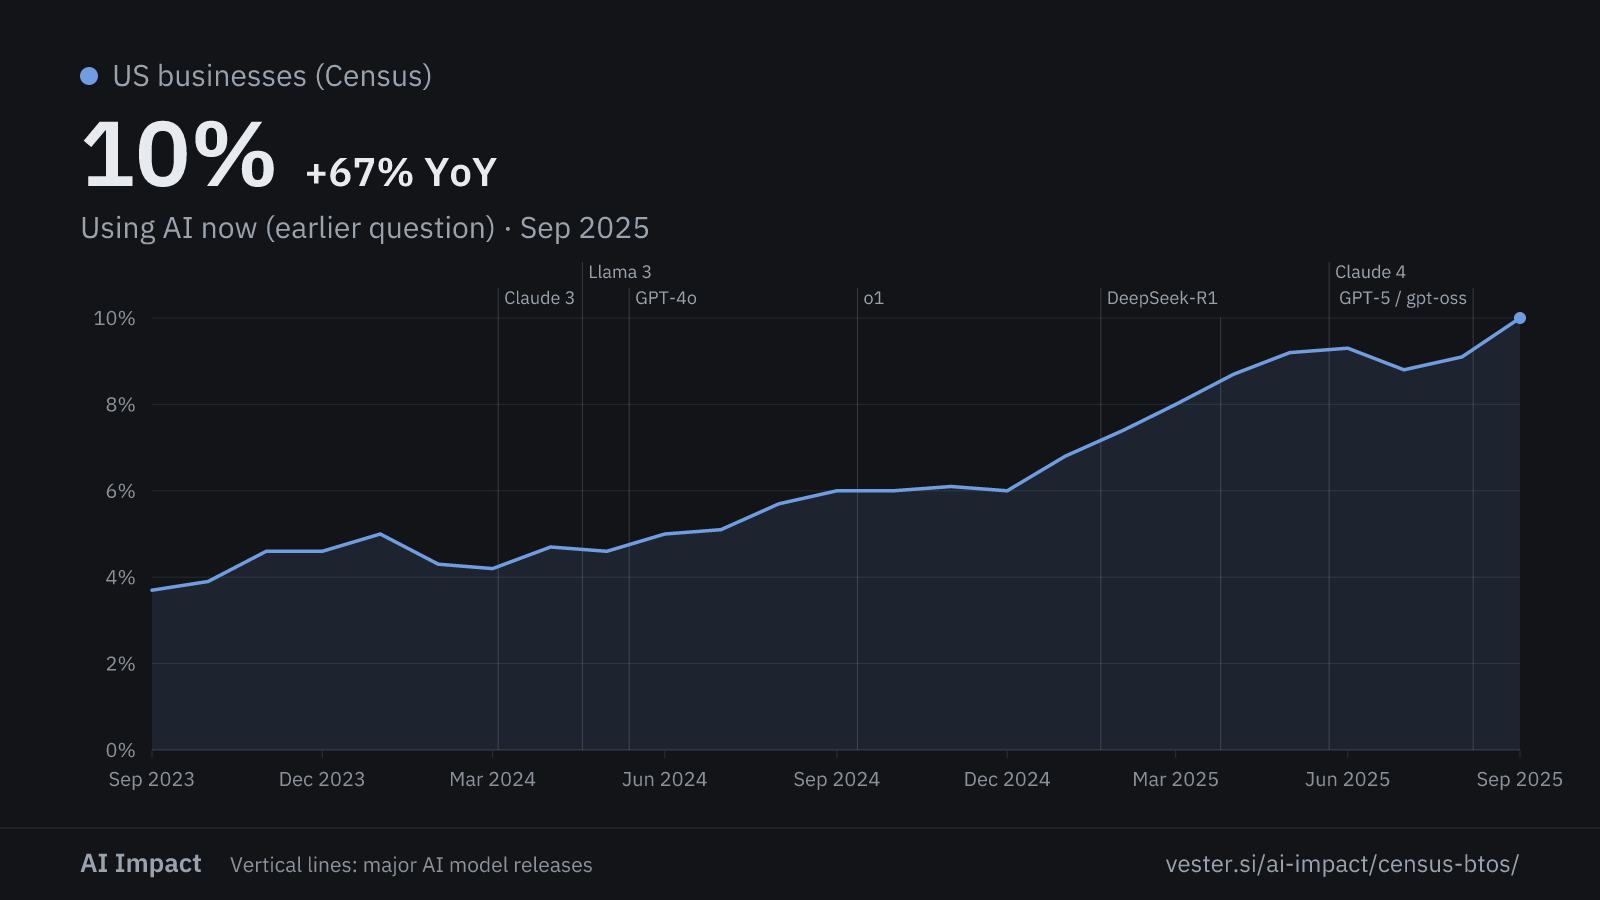
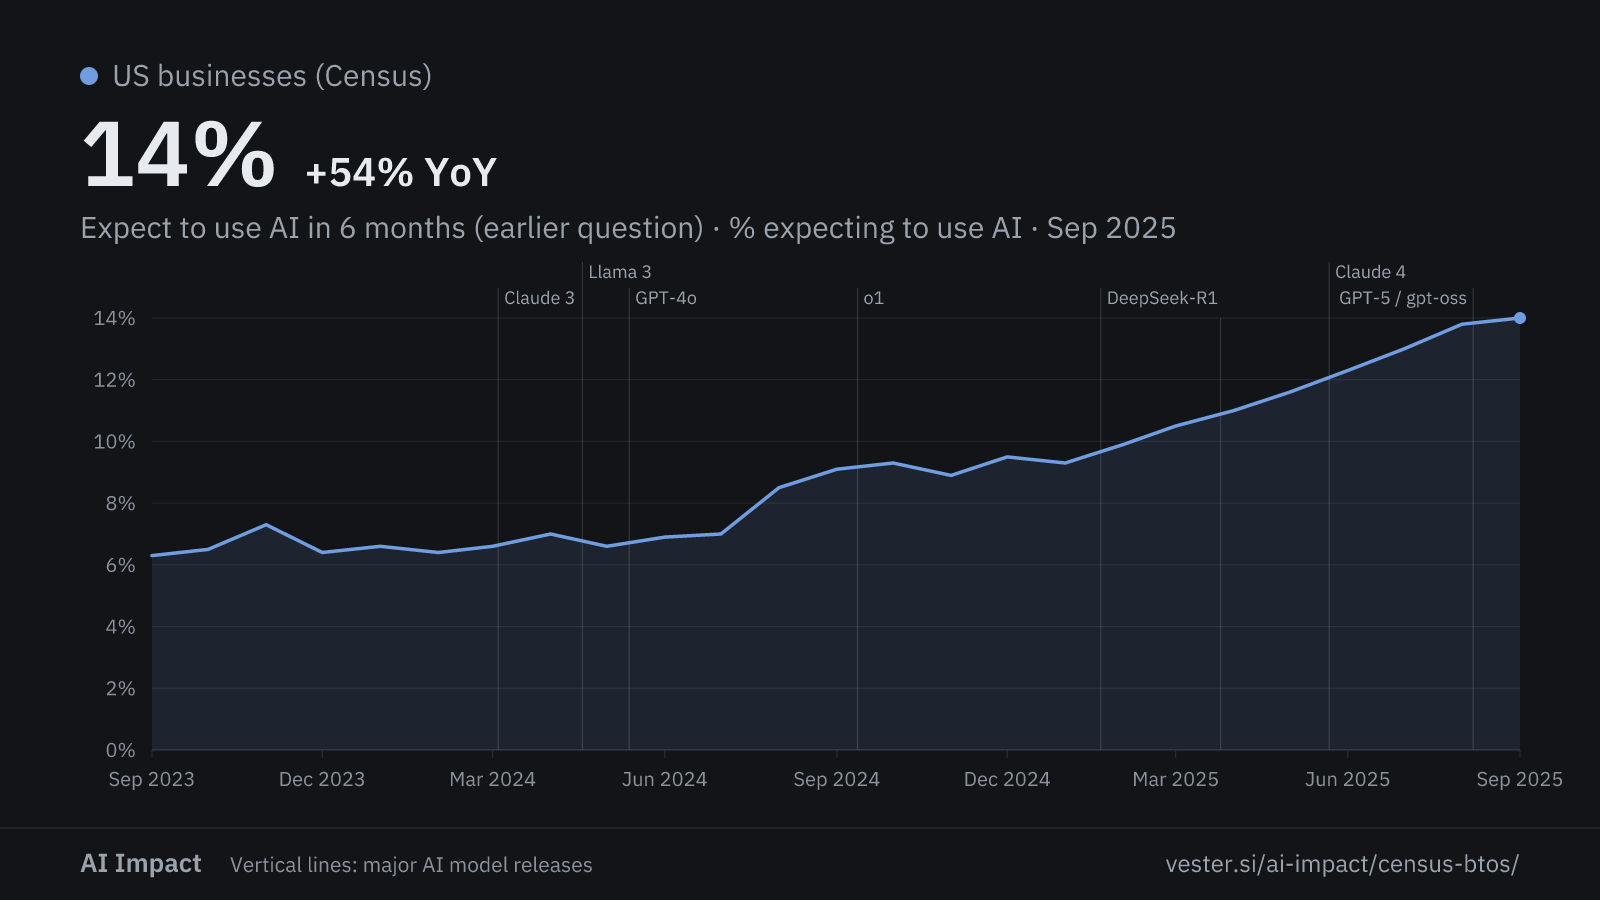
Nationwide · earlier question
These charts stop in September 2025. The Census asked a narrower question then, so the numbers are lower.
By sector · earlier question
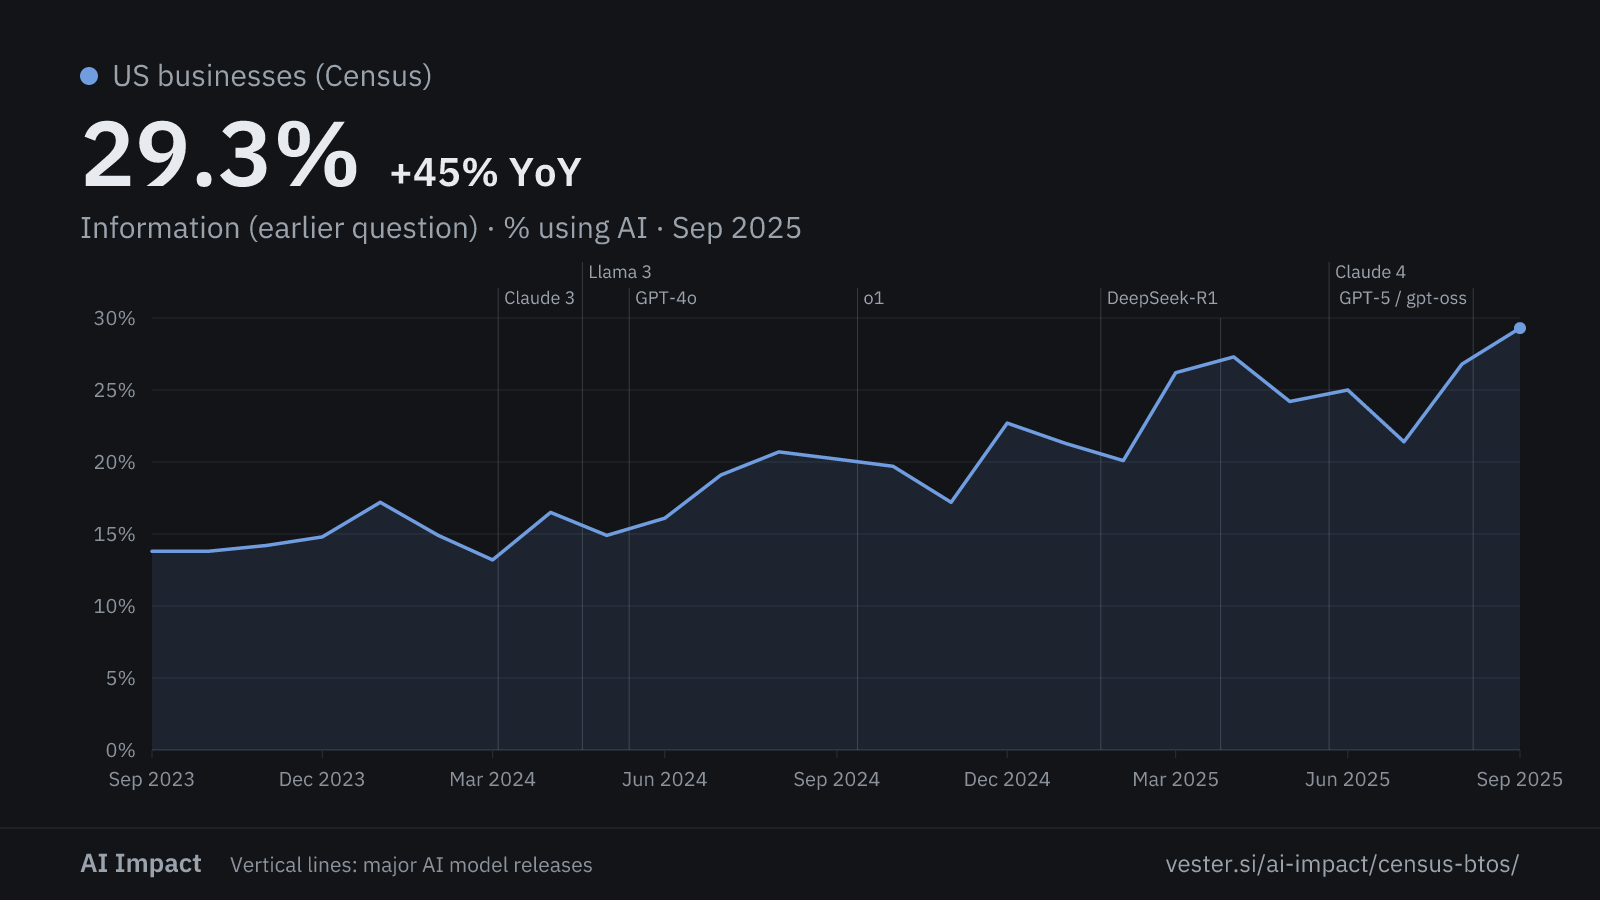
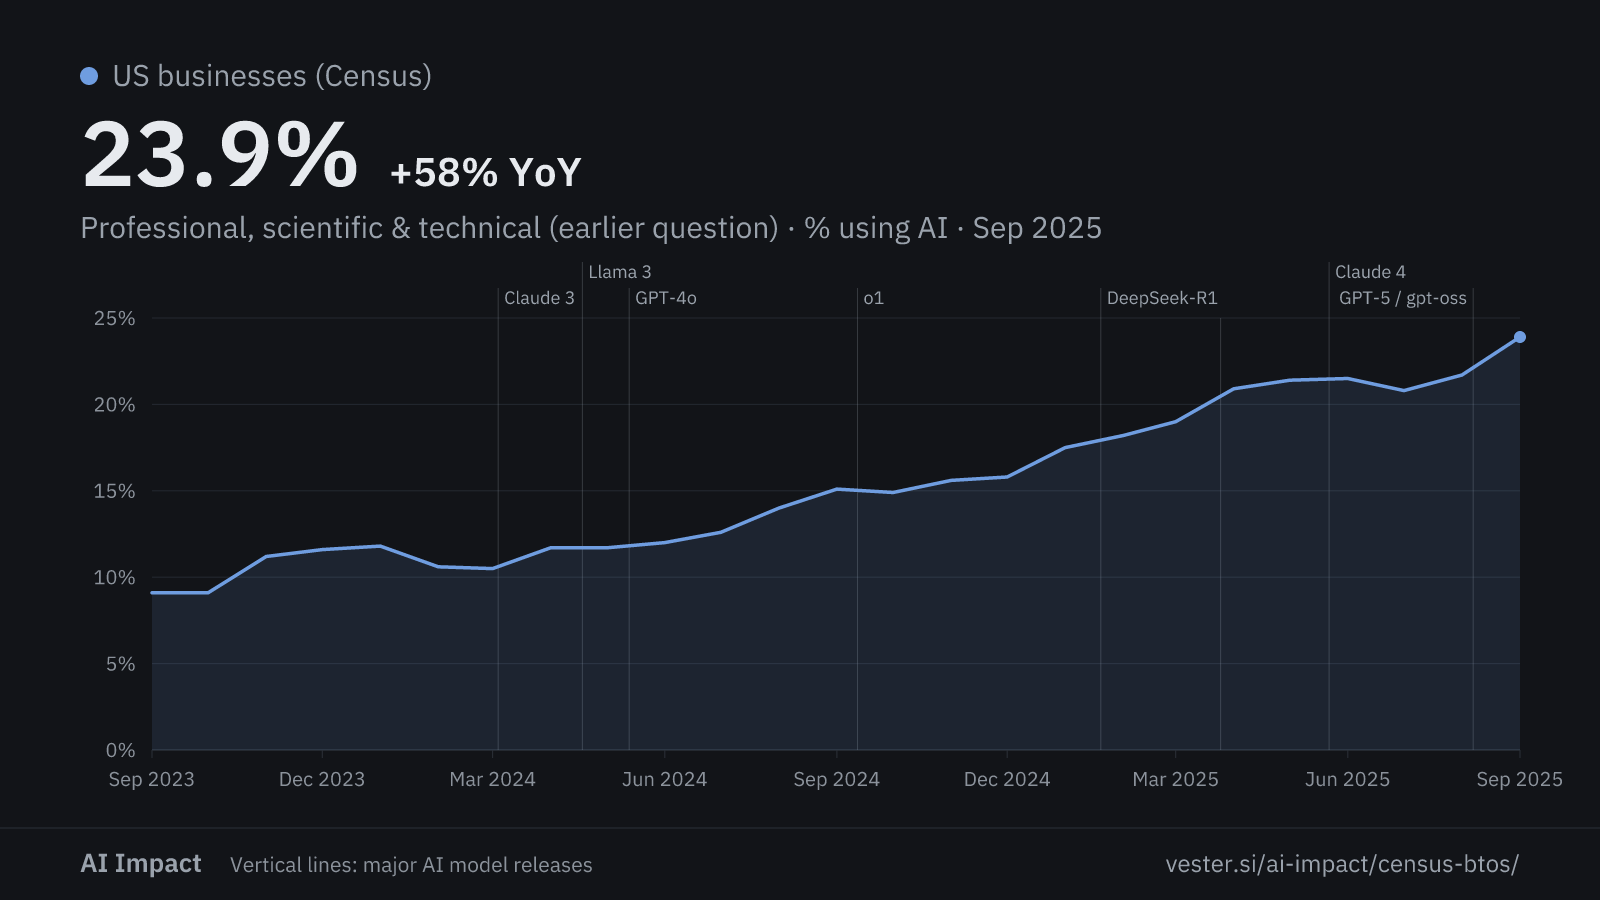
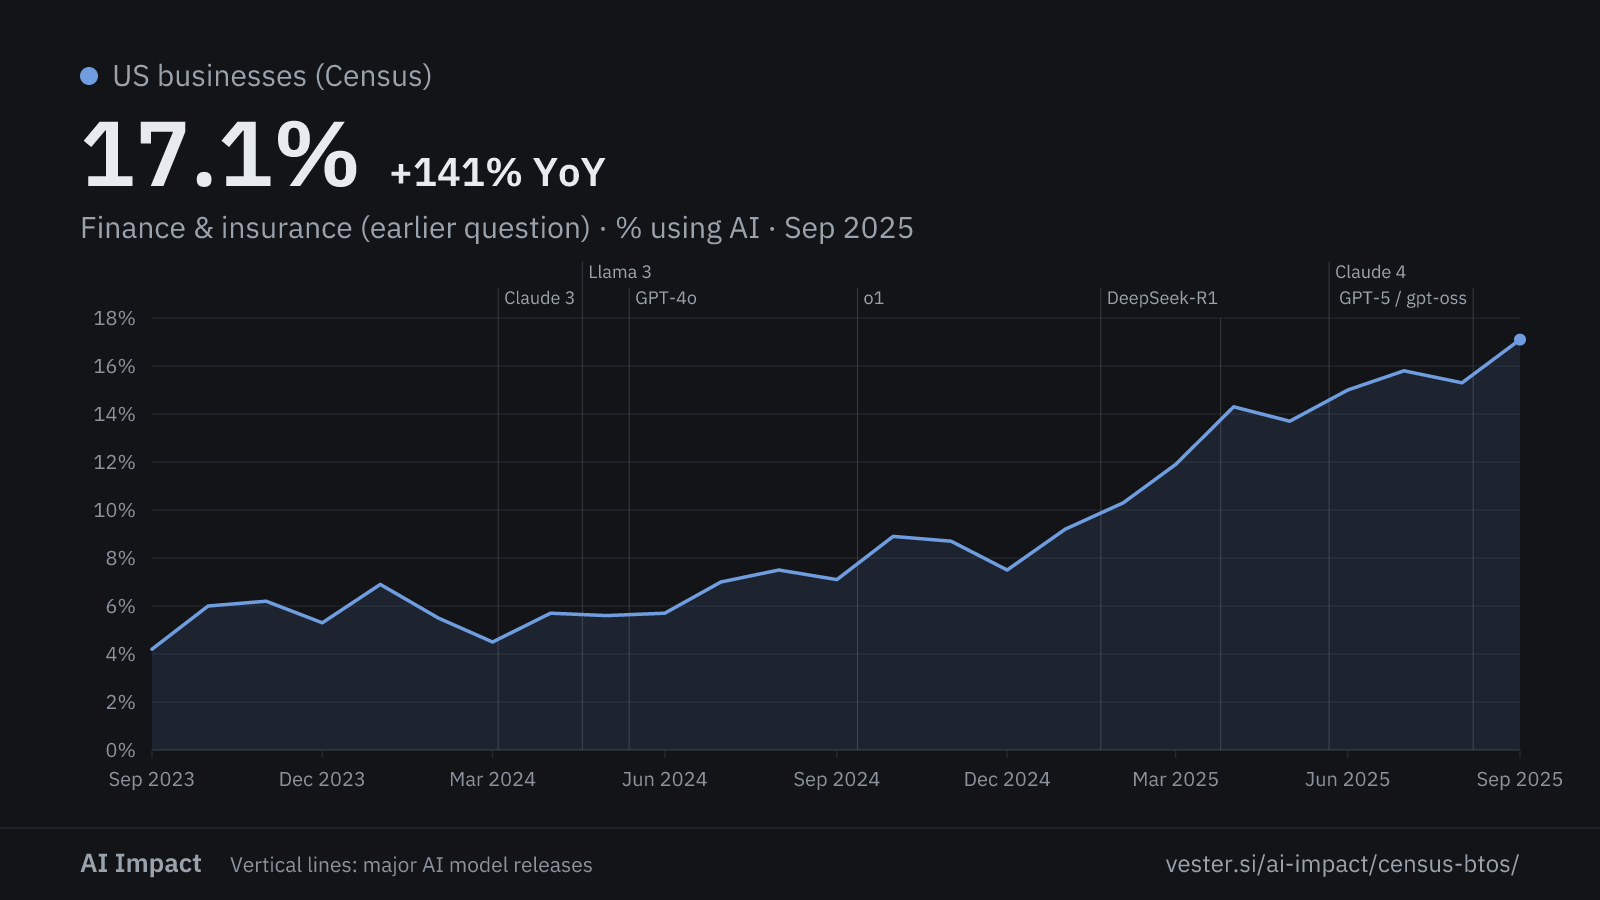
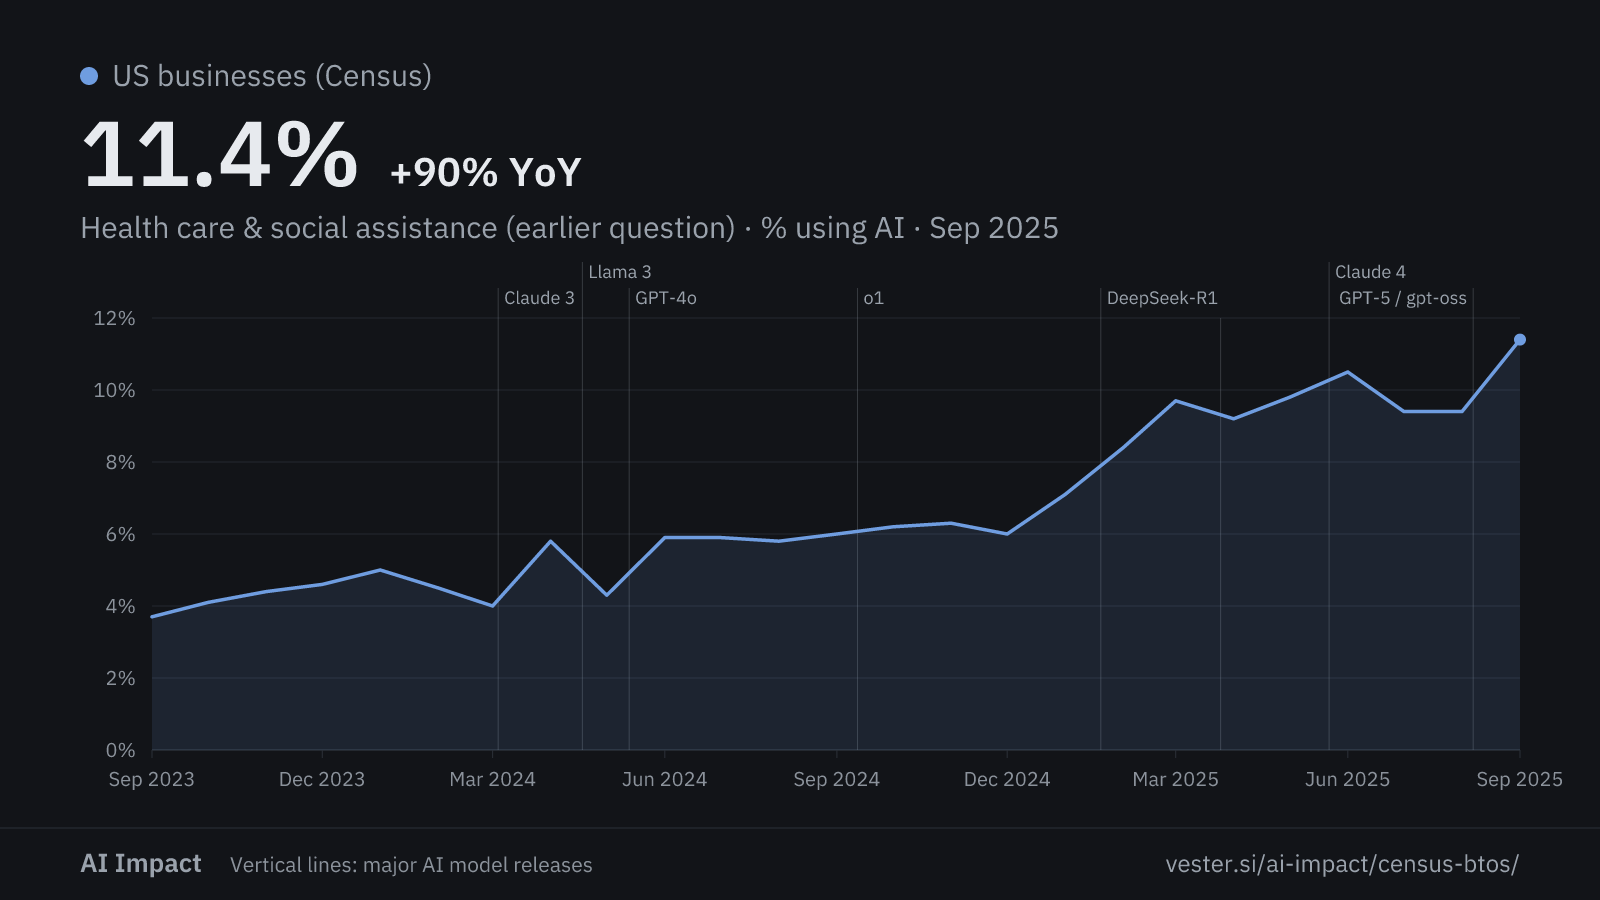
The Census asks few businesses in each sector, so these charts jump around much more than the national charts.
Information (earlier question)
Professional, scientific & technical (earlier question)
Finance & insurance (earlier question)
Health care & social assistance (earlier question)
Manufacturing (earlier question)
Retail trade (earlier question)
Construction (earlier question)
Accommodation & food services (earlier question)
Figures
| Series | Latest | Change | Min | Max | Coverage |
|---|---|---|---|---|---|
| Using AI now | 23.8% | +38.4% 10 mo | 17.2% | 23.8% | Nov 2025 — Sep 2026 |
| Expect to use AI in 6 months | 27.7% | +32.5% 10 mo | 20.9% | 27.7% | Nov 2025 — Sep 2026 |
| Information | 50.2% | +56.4% 10 mo | 30.3% | 50.2% | Nov 2025 — Sep 2026 |
| Professional, scientific & technical | 42.7% | +33.4% 10 mo | 32% | 43.3% | Nov 2025 — Sep 2026 |
| Finance & insurance | 40.1% | +36.4% 10 mo | 29.4% | 40.1% | Nov 2025 — Sep 2026 |
| Health care & social assistance | 24.8% | +15.9% 10 mo | 20.5% | 24.8% | Nov 2025 — Sep 2026 |
| Manufacturing | 20.8% | +98.1% 10 mo | 10.5% | 23.4% | Nov 2025 — Sep 2026 |
| Retail trade | 16.8% | +28.2% 10 mo | 11.1% | 17.4% | Nov 2025 — Sep 2026 |
| Construction | 17.2% | +84.9% 10 mo | 8.3% | 17.2% | Nov 2025 — Sep 2026 |
| Accommodation & food services | 10.1% | +29.5% 10 mo | 7.3% | 10.1% | Nov 2025 — Sep 2026 |
| Using AI now (earlier question) | 10% | +66.7% yr | 3.7% | 10% | Sep 2023 — Sep 2025 |
| Expect to use AI in 6 months (earlier question) | 14% | +53.8% yr | 6.3% | 14% | Sep 2023 — Sep 2025 |
| Information (earlier question) | 29.3% | +45.0% yr | 13.2% | 29.3% | Sep 2023 — Sep 2025 |
| Professional, scientific & technical (earlier question) | 23.9% | +58.3% yr | 9.1% | 23.9% | Sep 2023 — Sep 2025 |
| Finance & insurance (earlier question) | 17.1% | +140.8% yr | 4.2% | 17.1% | Sep 2023 — Sep 2025 |
| Health care & social assistance (earlier question) | 11.4% | +90.0% yr | 3.7% | 11.4% | Sep 2023 — Sep 2025 |
| Manufacturing (earlier question) | 4.6% | +84.0% yr | 1.7% | 5.2% | Sep 2023 — Sep 2025 |
| Retail trade (earlier question) | 6.3% | +70.3% yr | 2.3% | 6.3% | Sep 2023 — Sep 2025 |
| Construction (earlier question) | 4.5% | +164.7% yr | 0.9% | 4.5% | Sep 2023 — Sep 2025 |
| Accommodation & food services (earlier question) | 2% | +17.6% yr | 0.9% | 3.1% | Sep 2023 — Sep 2025 |