US jobs (BLS)
US payroll employment per month from the BLS Current Employment Statistics since 2015: the AI-exposed industries (call centres, clerical work, graphic design, news publishing), the software and IT-services industries, sector baselines and controls, and a derived share — plus the job openings, hiring, quit and layoff rates from the companion JOLTS survey, which count who moved in and out of those jobs.
The BLS counts each job by the industry of the employer, not by the work the person does. A designer at a bank counts as a bank job. Every chart here shows an industry, and it only stands in for an occupation.
AI-exposed industries
We group these industries because people expect AI to cut jobs in them. That expectation is a guess, not a result. Two of these industries are flat or still grow.
Call centres & telemarketing
Telephone call centres (all)
Document preparation (data entry)
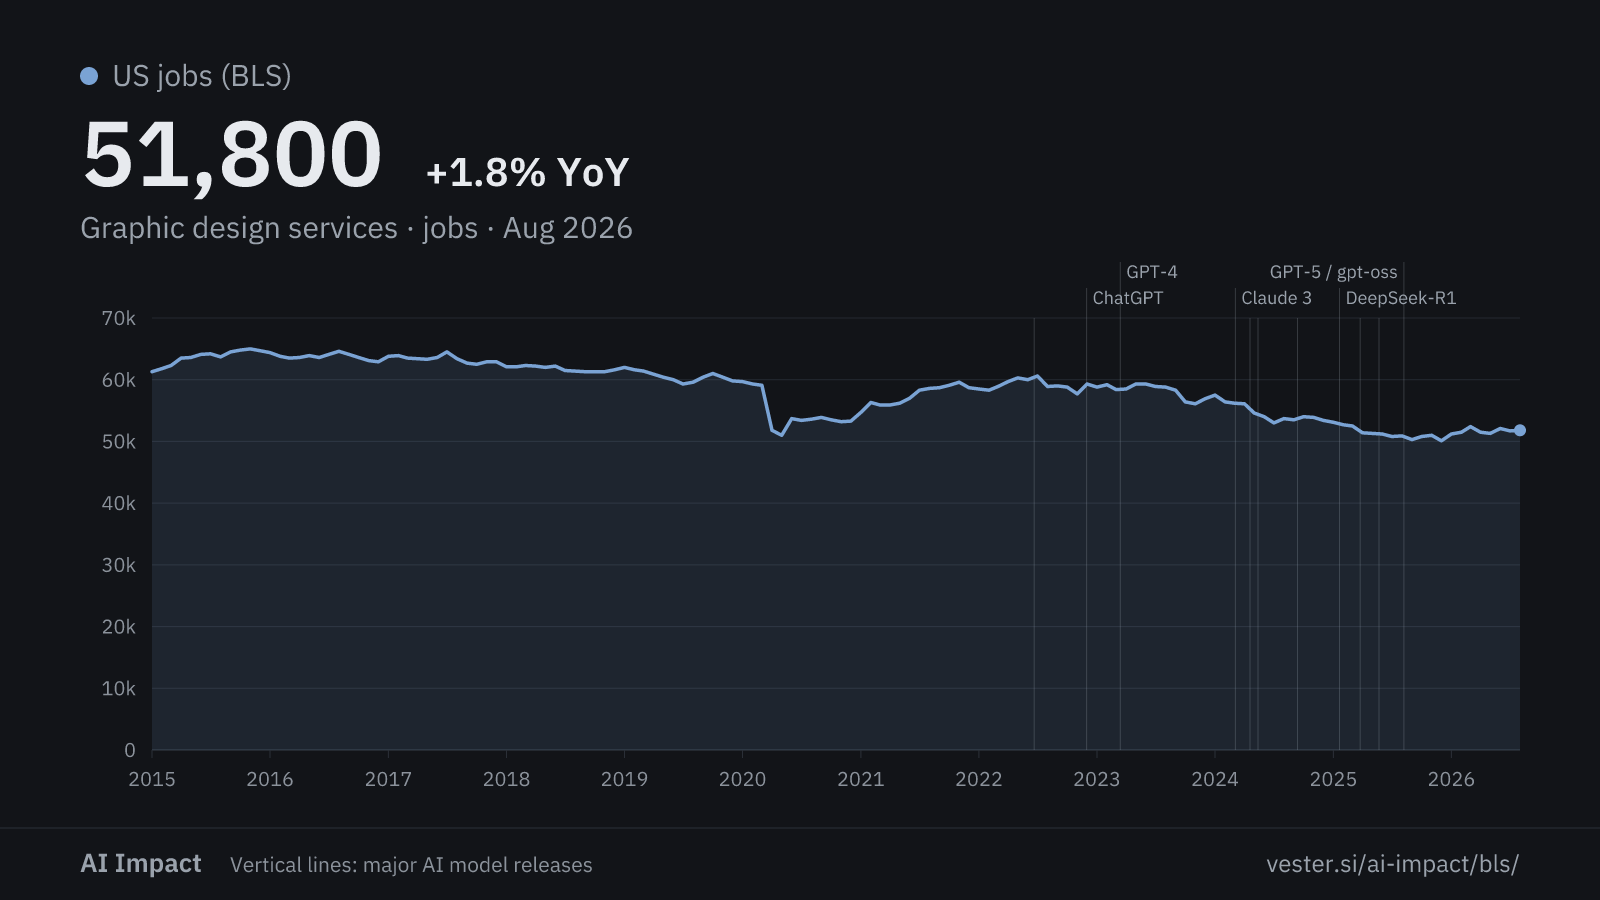
Graphic design services
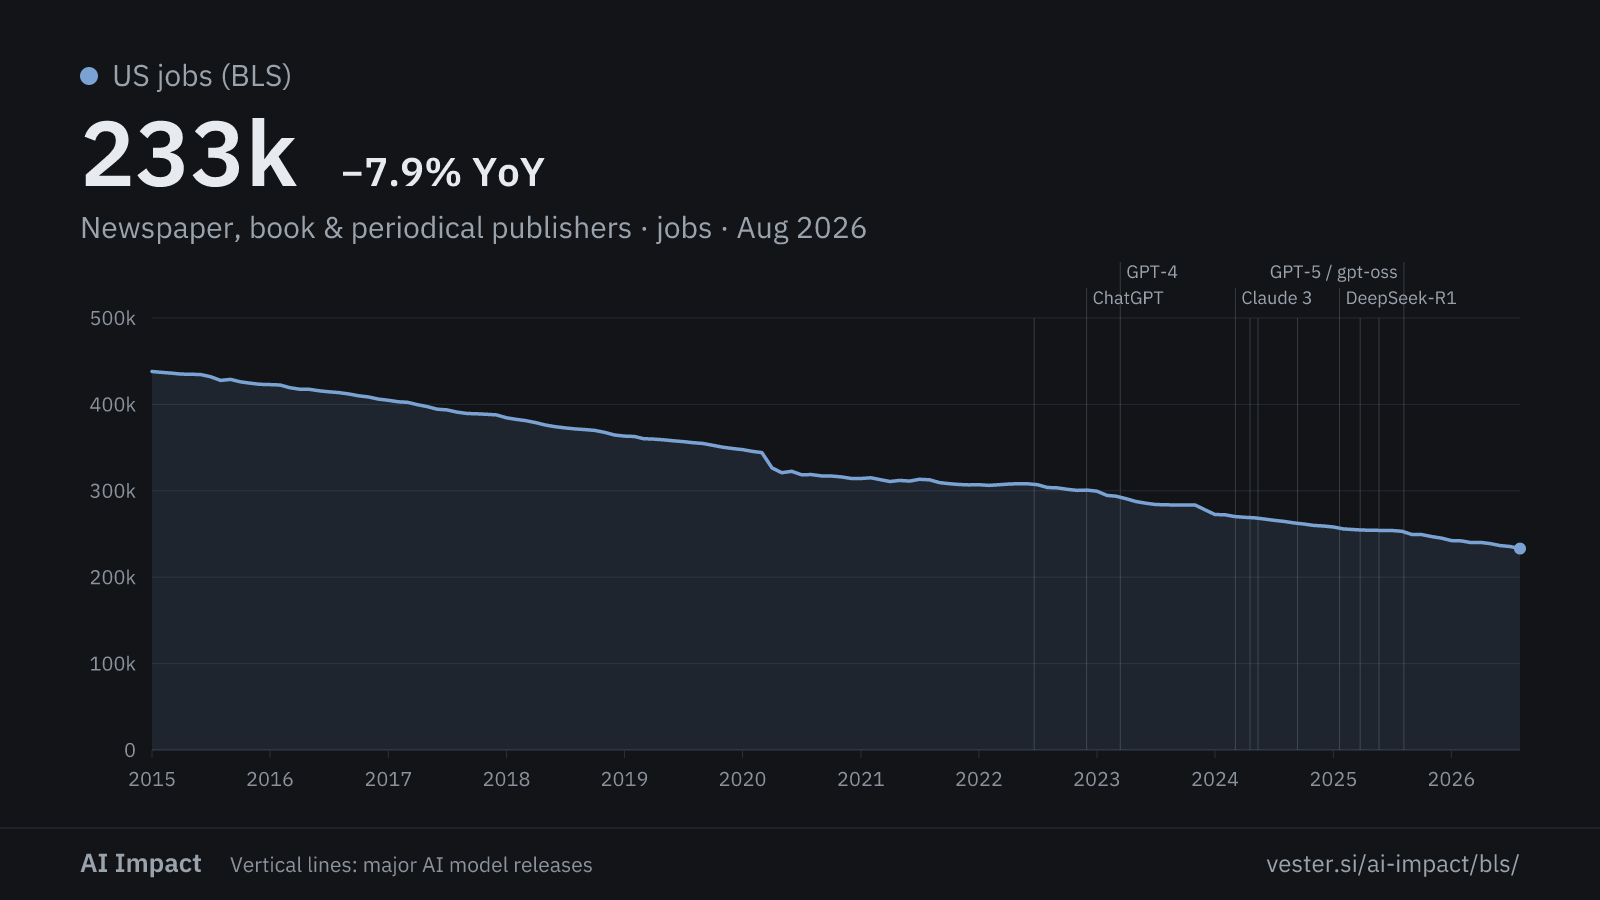
Newspaper, book & periodical publishers
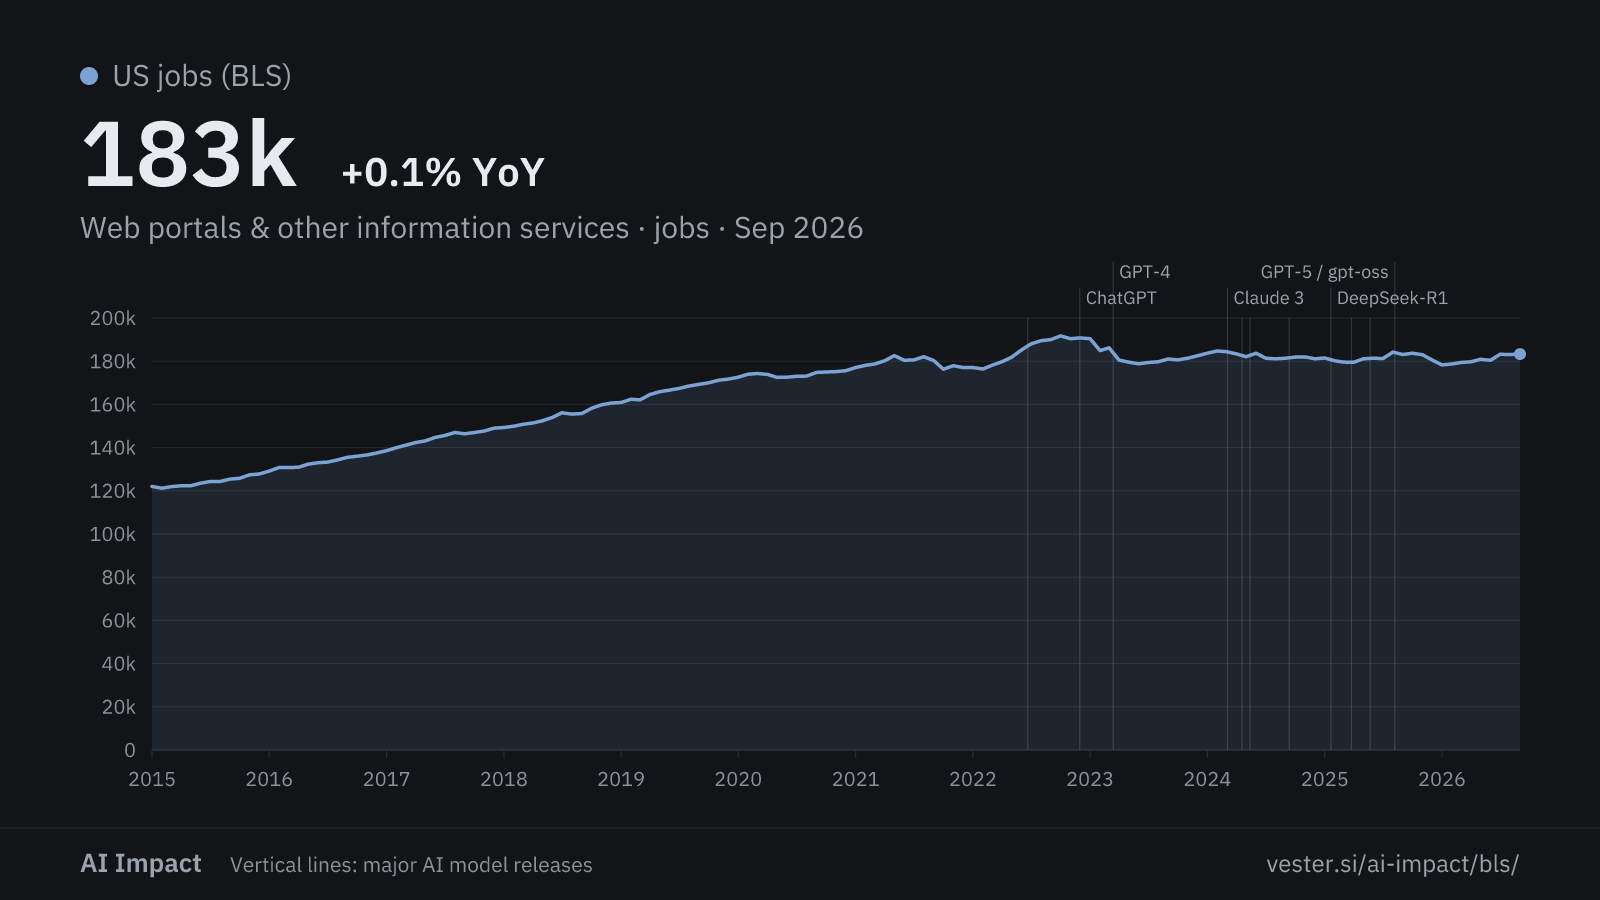
Web portals & other information services
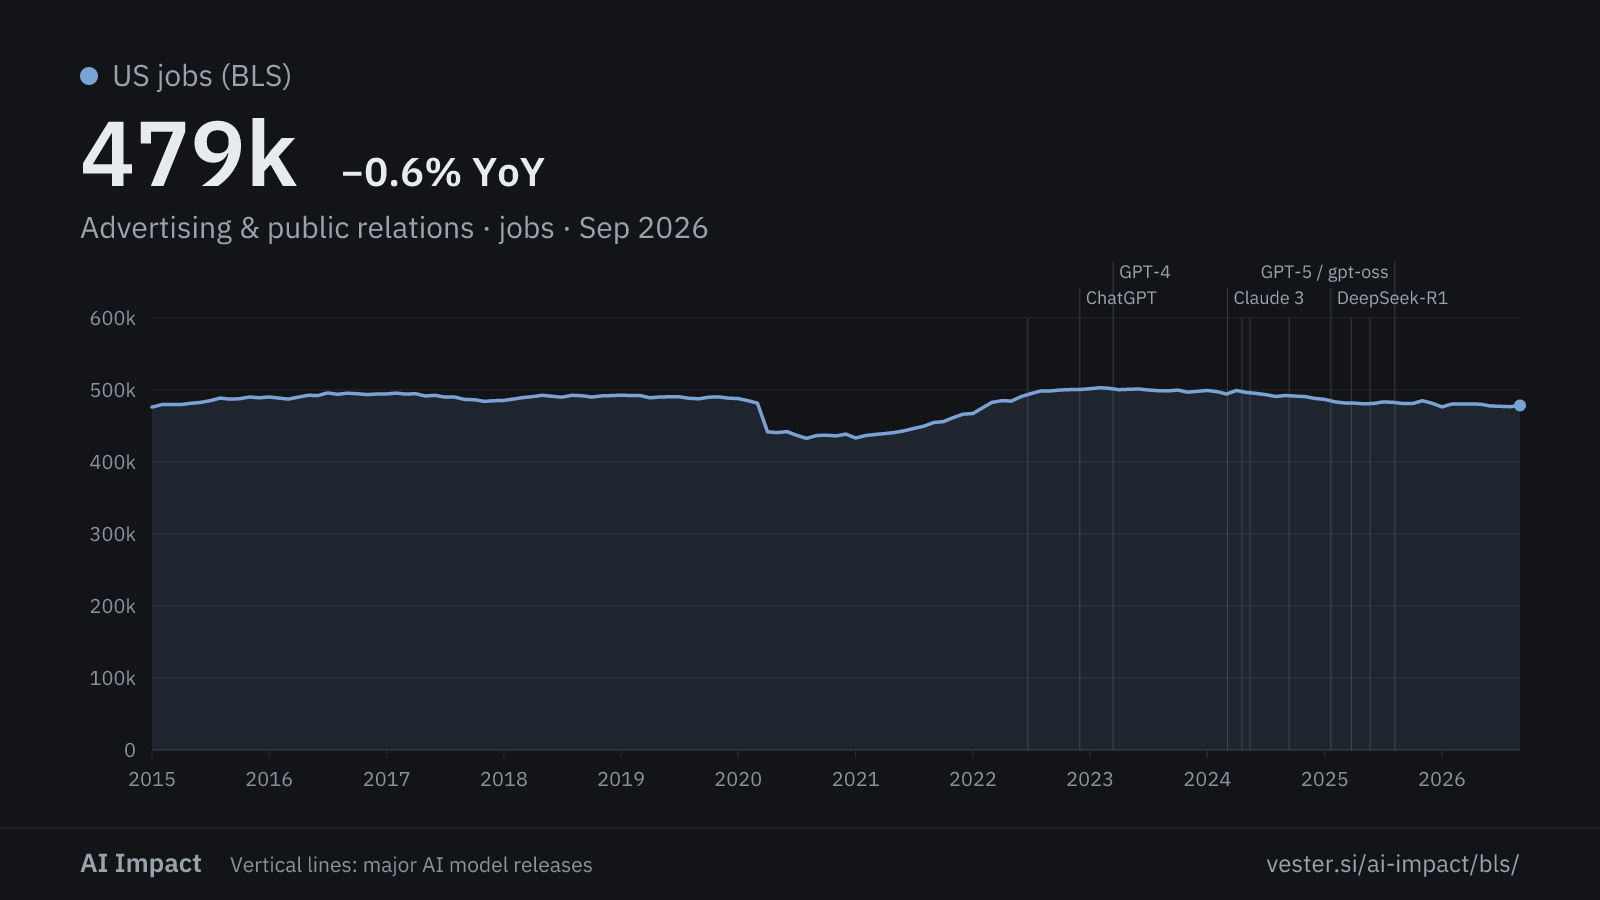
Advertising & public relations
Software & IT services
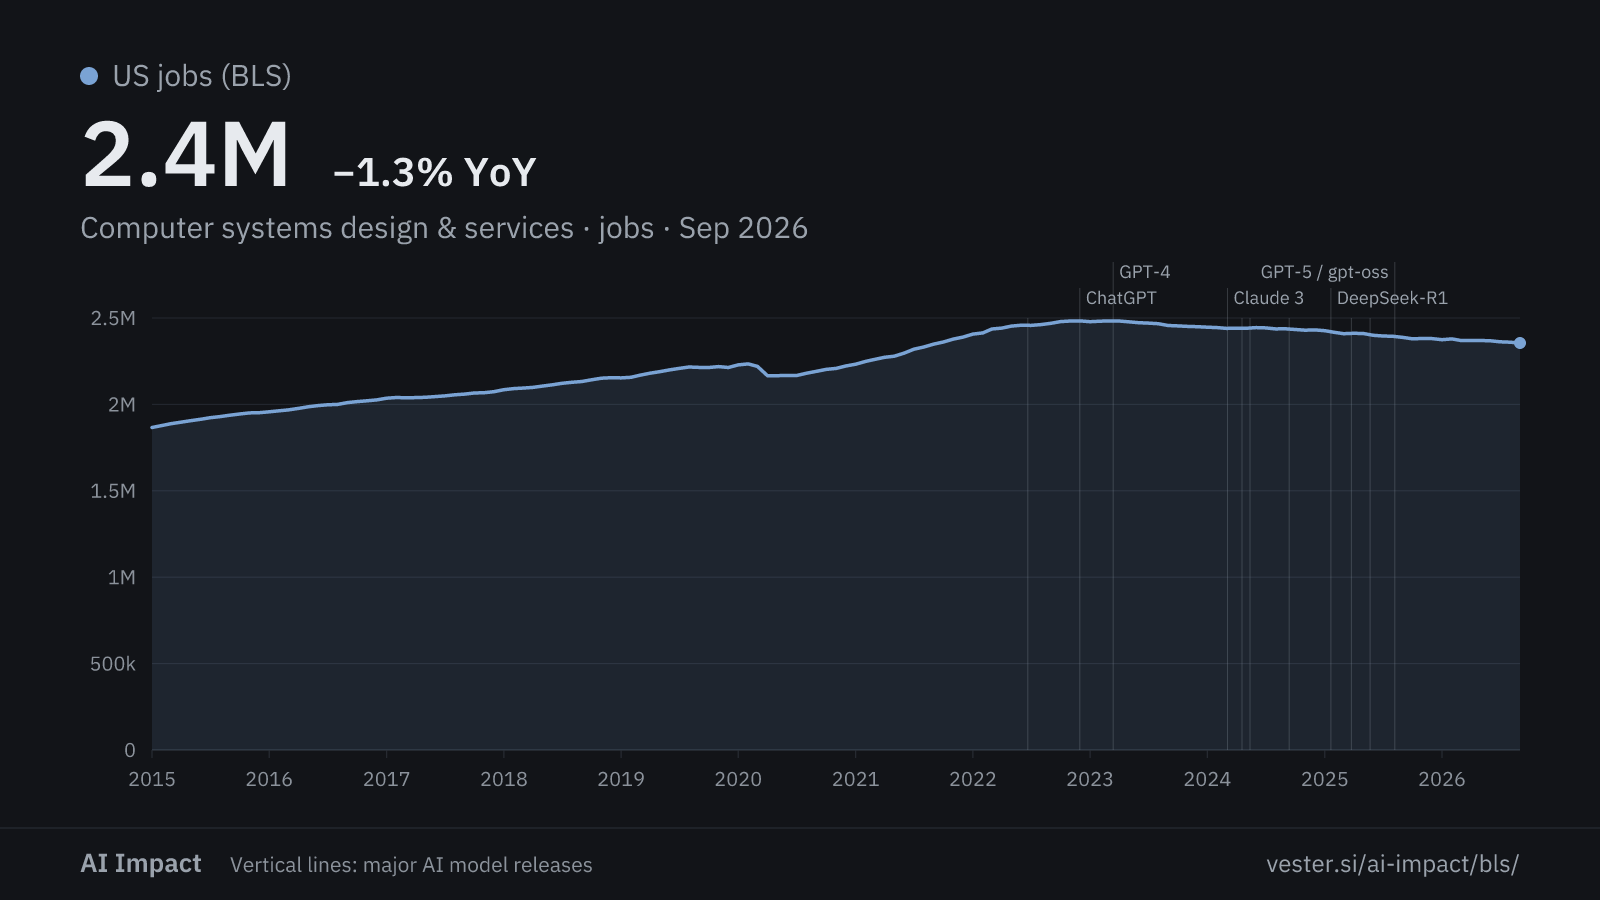
Computer systems design & services
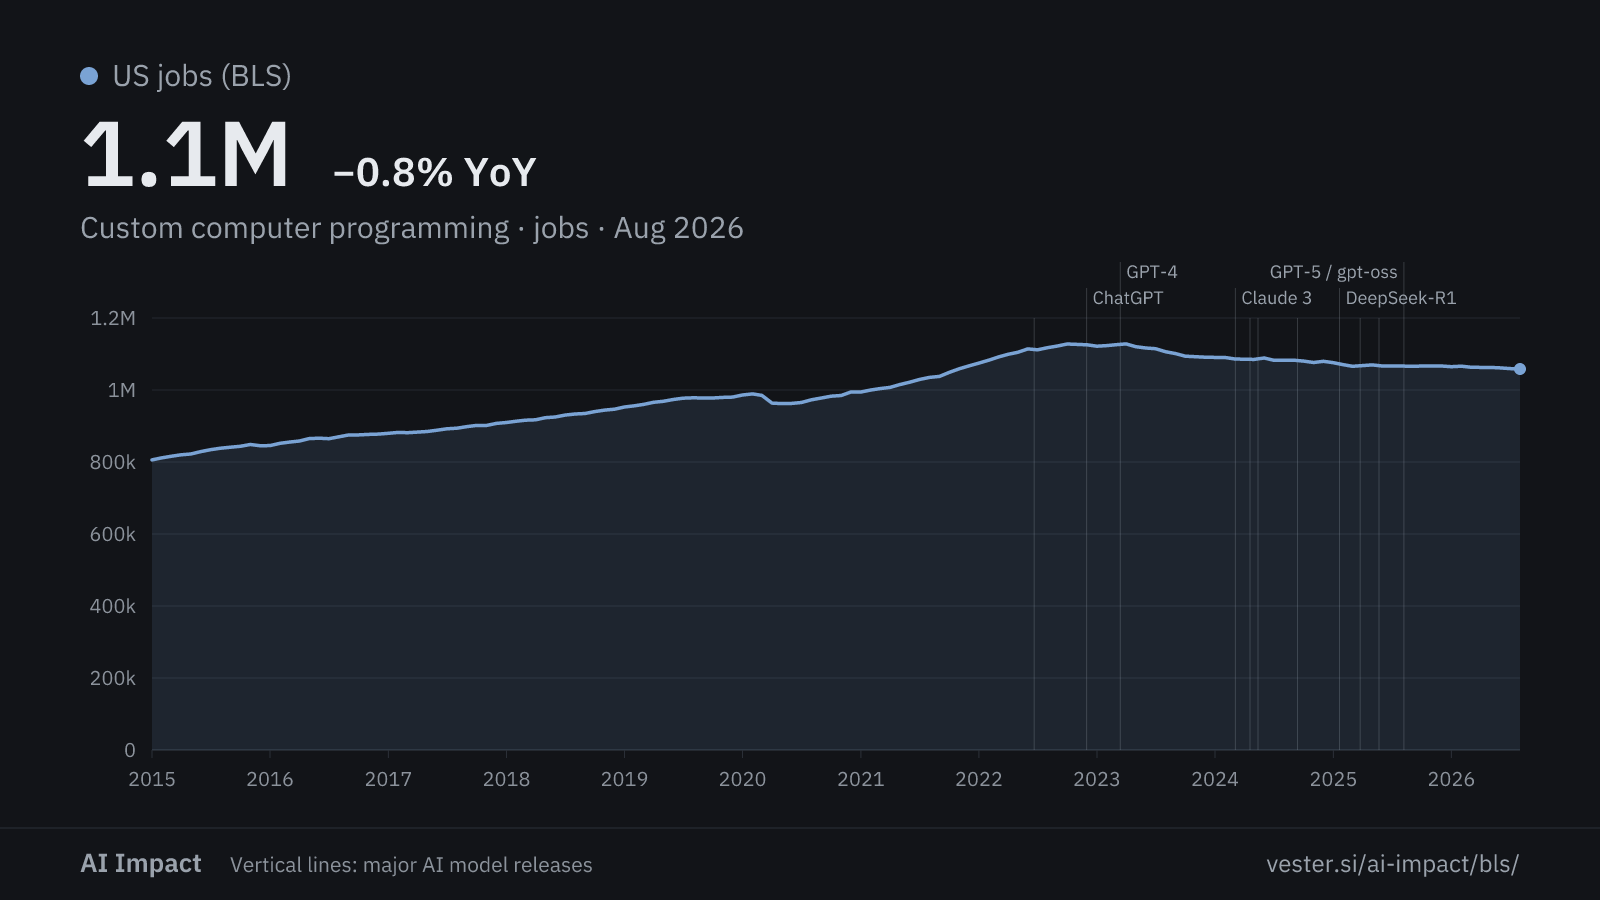
Custom computer programming
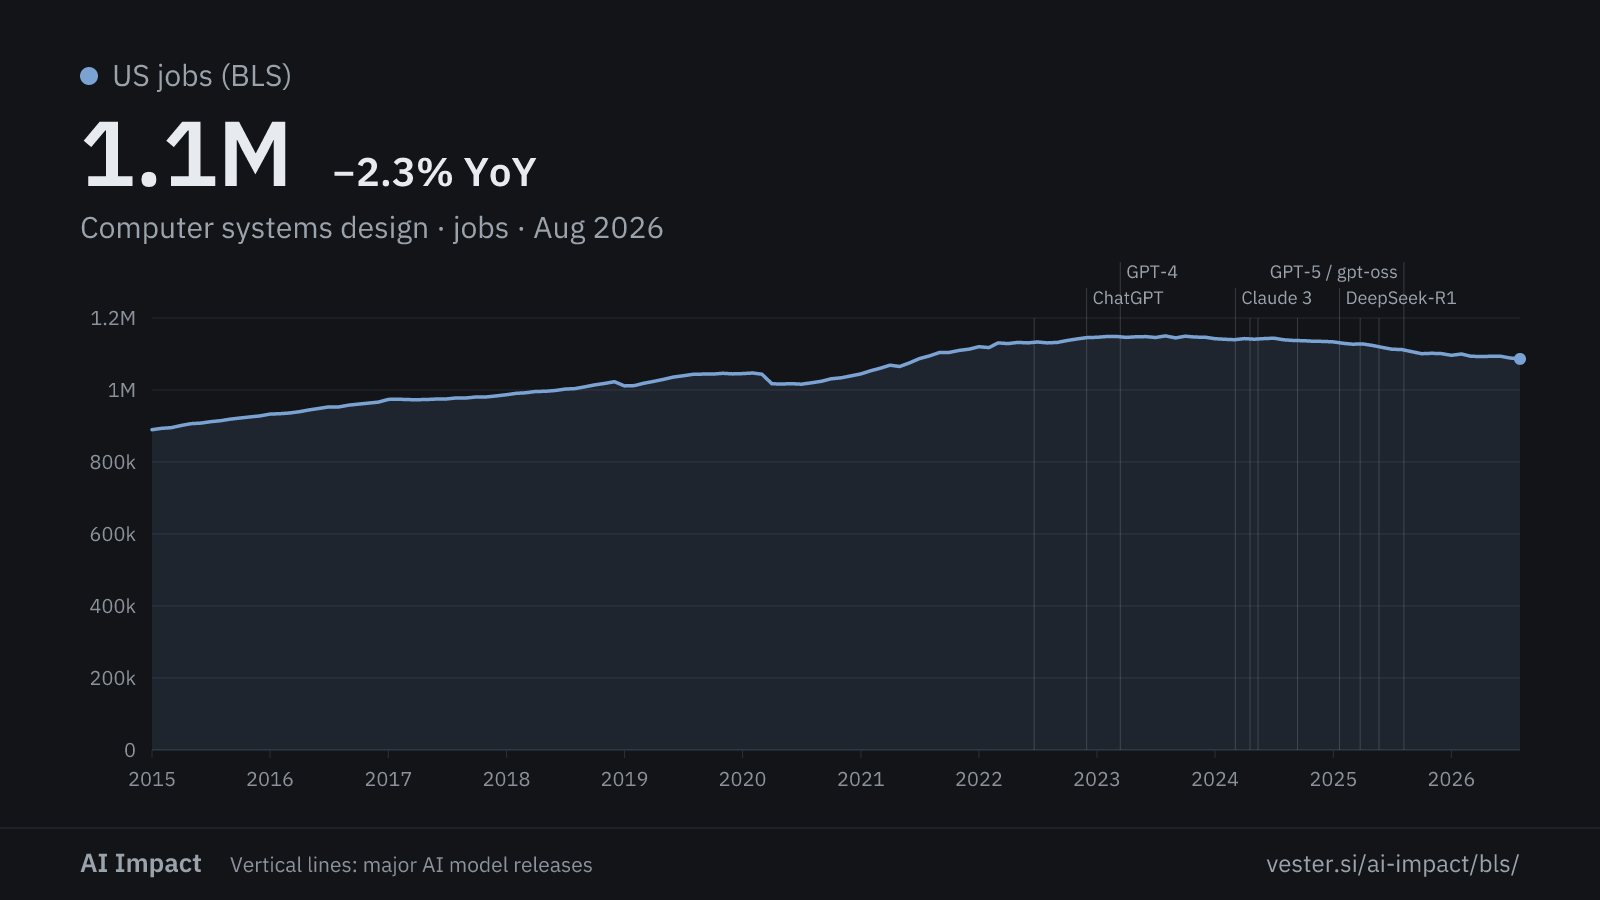
Computer systems design
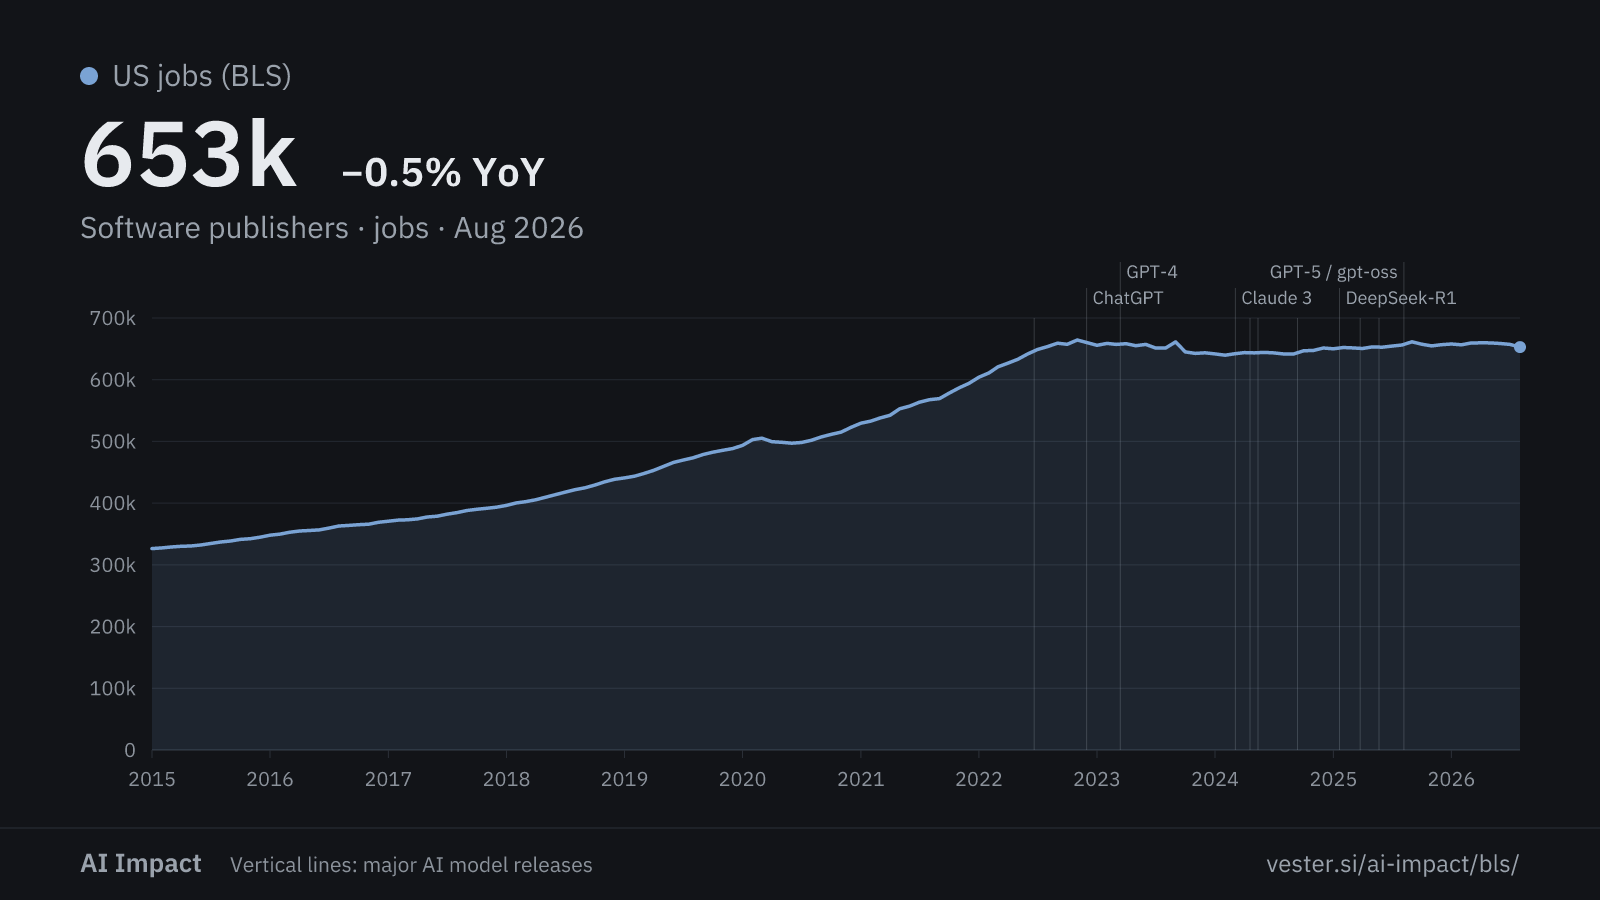
Software publishers
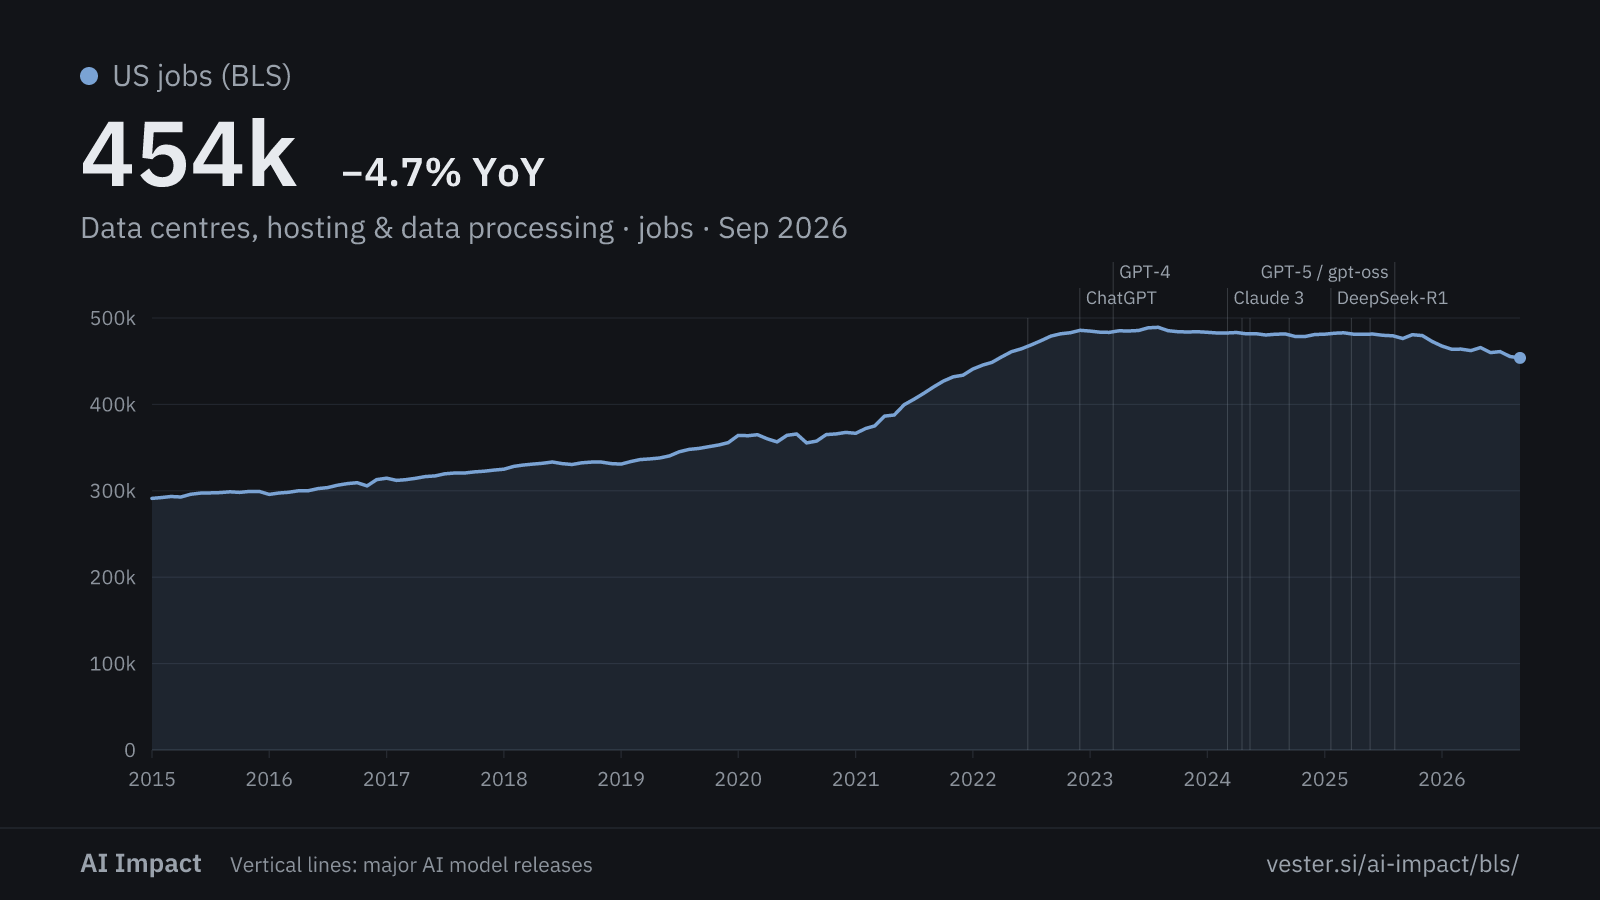
Data centres, hosting & data processing
Baselines & controls
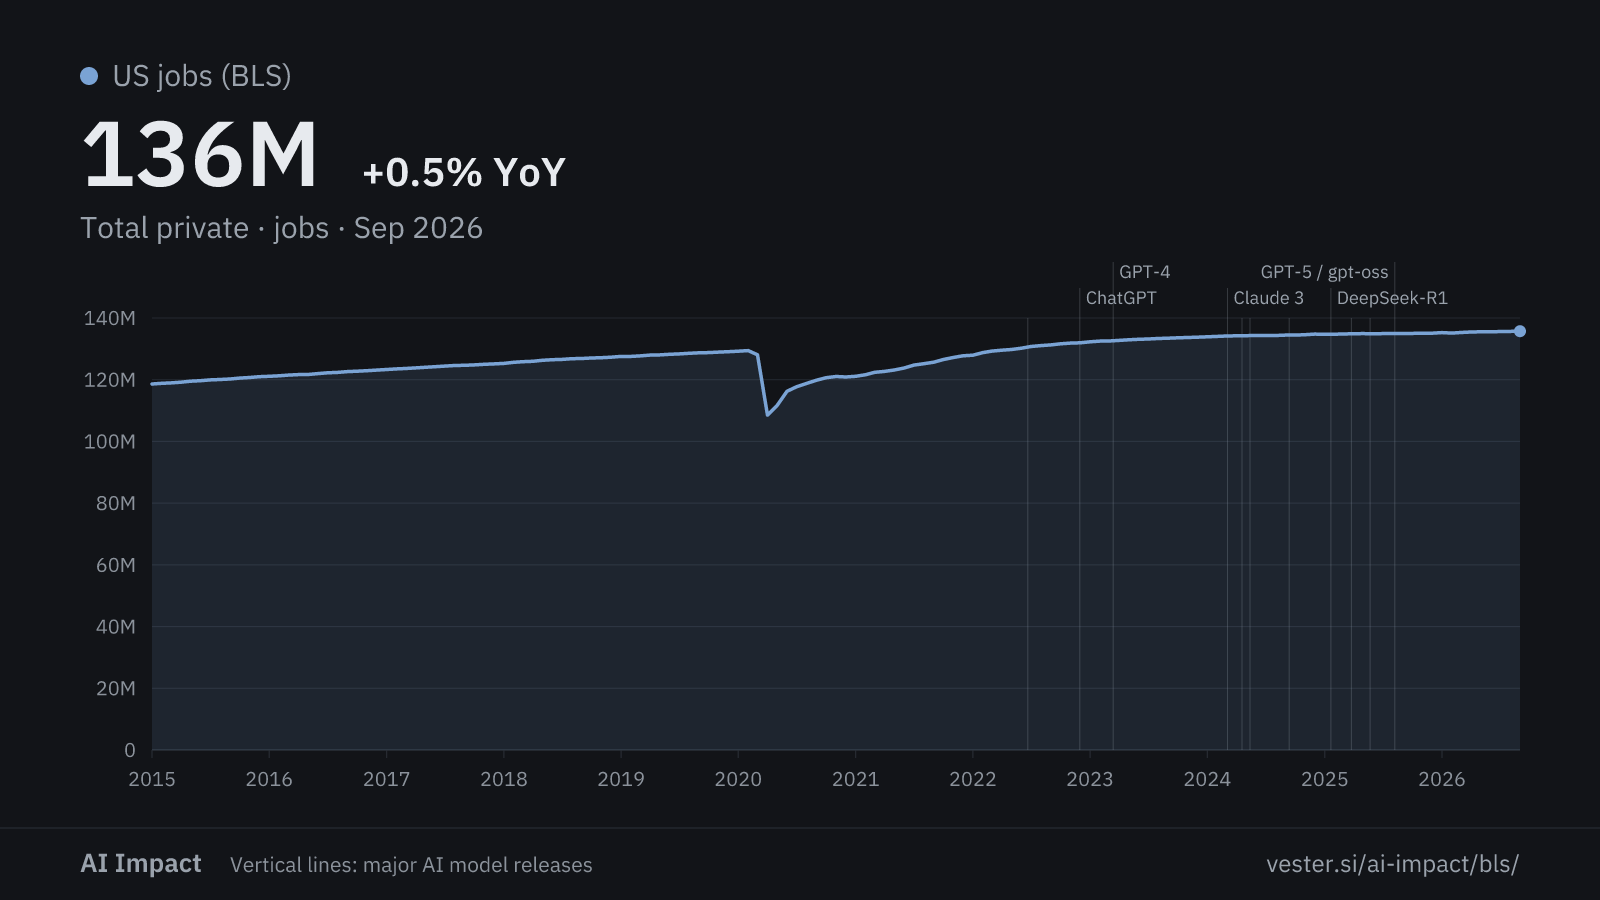
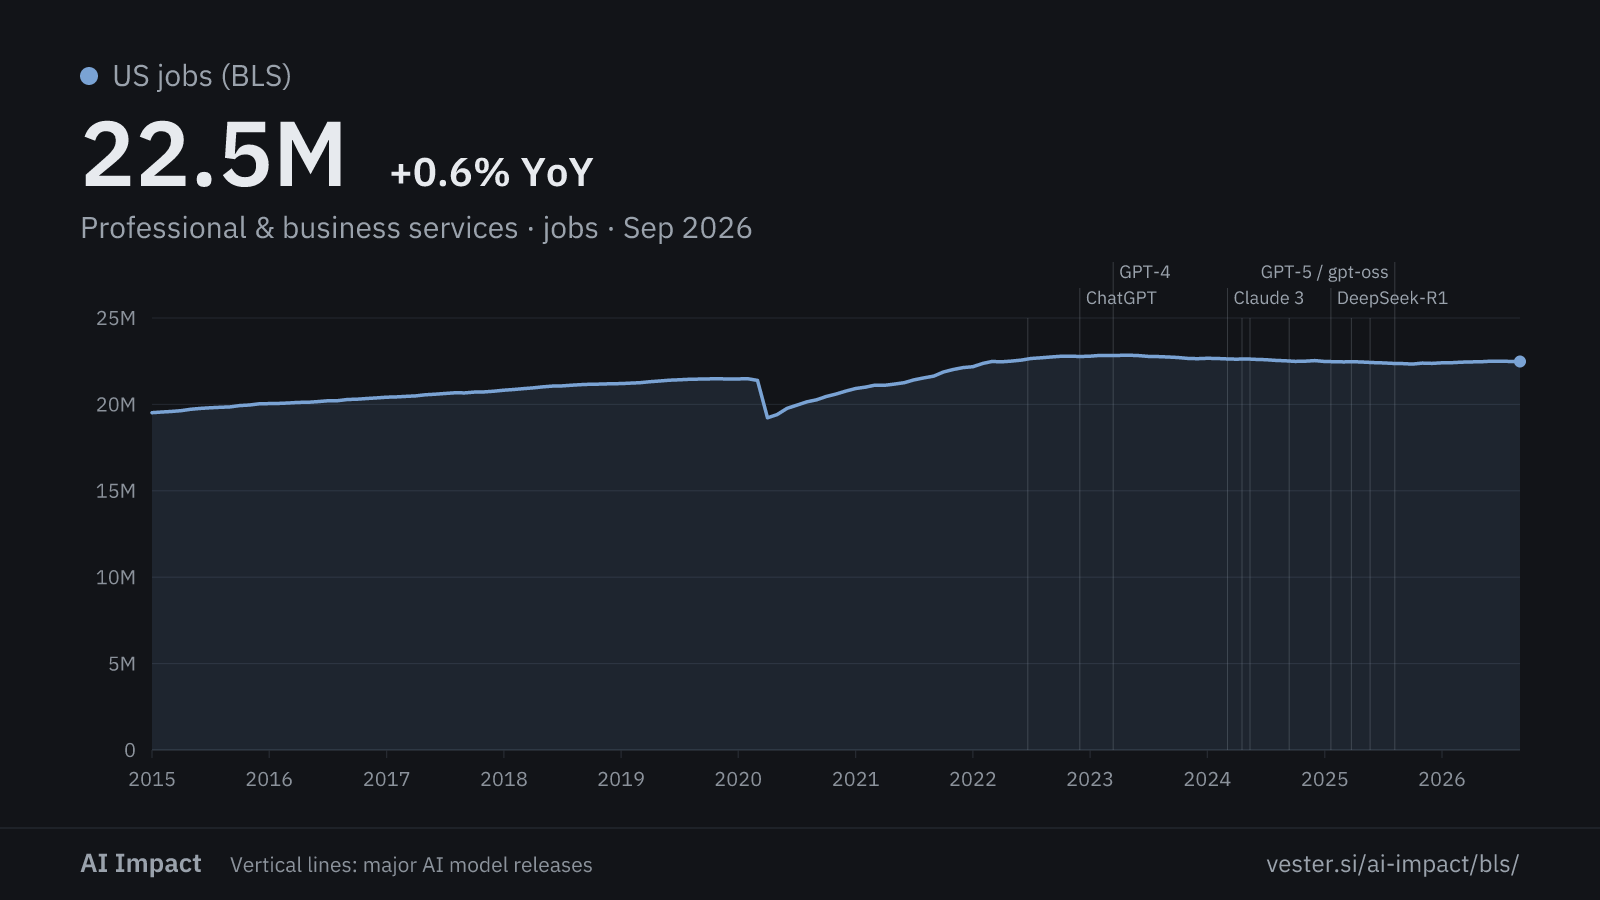
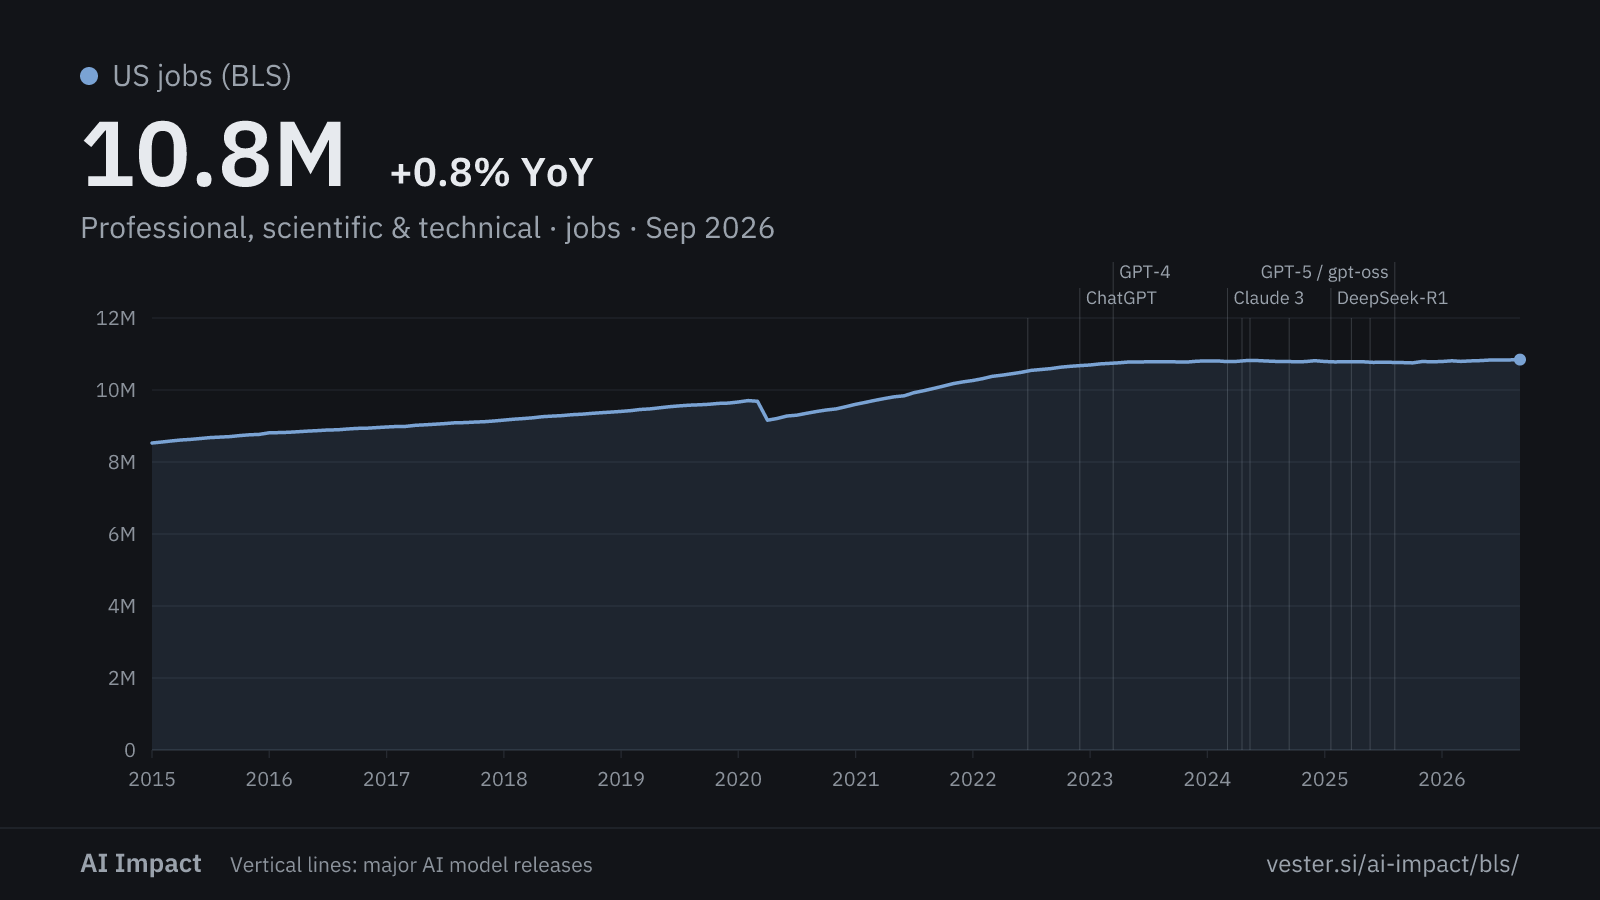
These lines are controls, not AI signals. They show the wider sectors and the business cycle. Compare every other chart on this page with them before you blame AI.
Total private
Professional & business services
Professional, scientific & technical
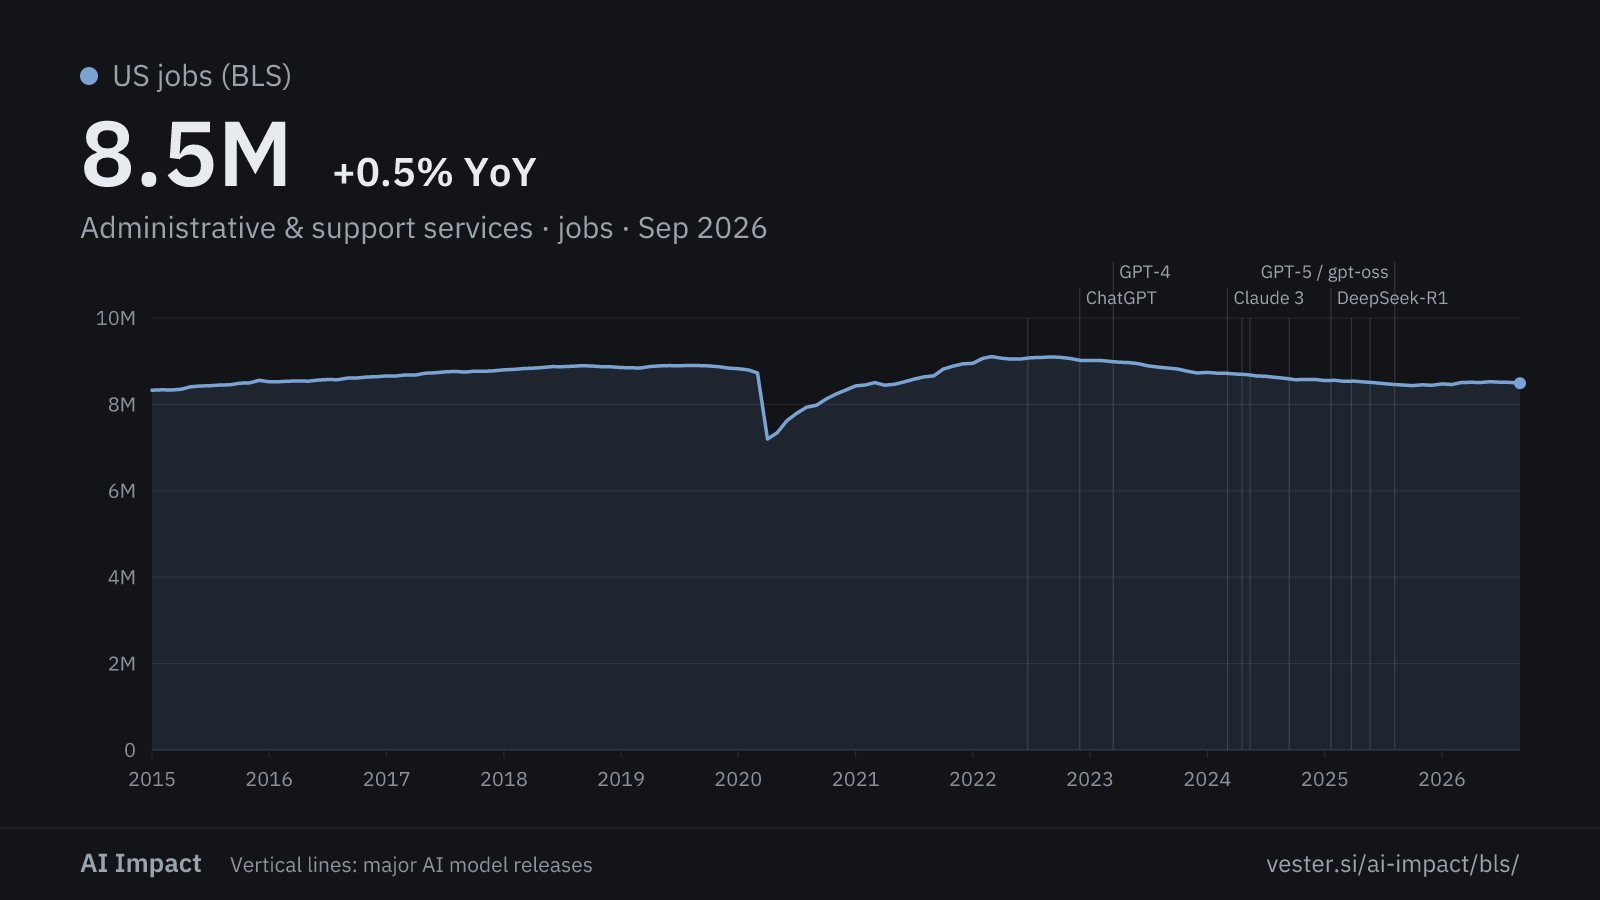
Administrative & support services
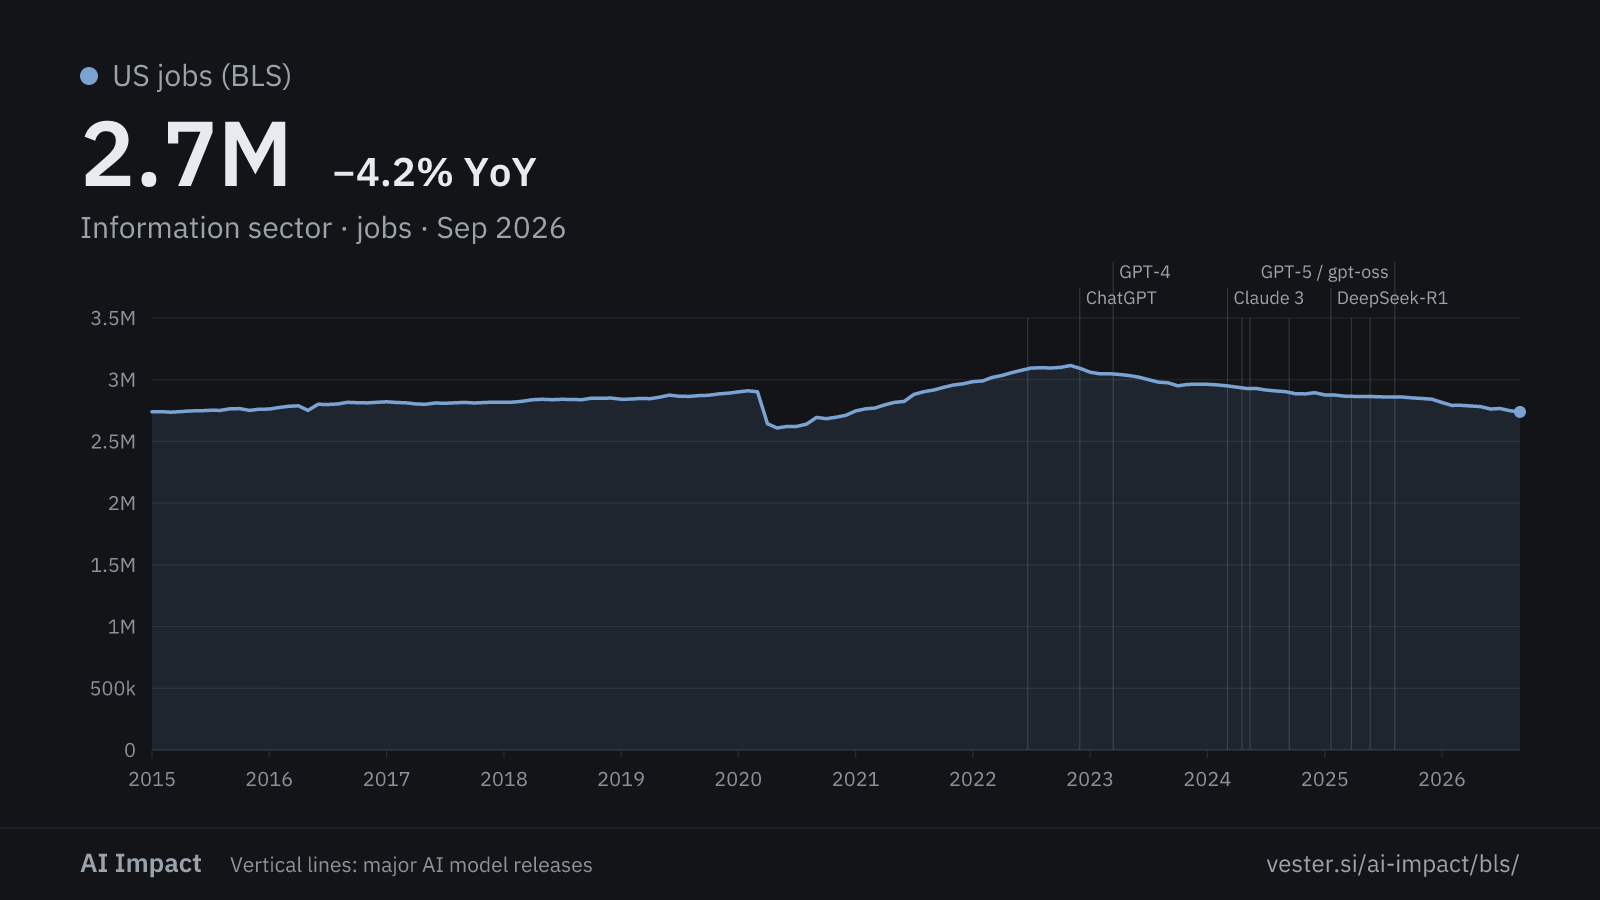
Information sector
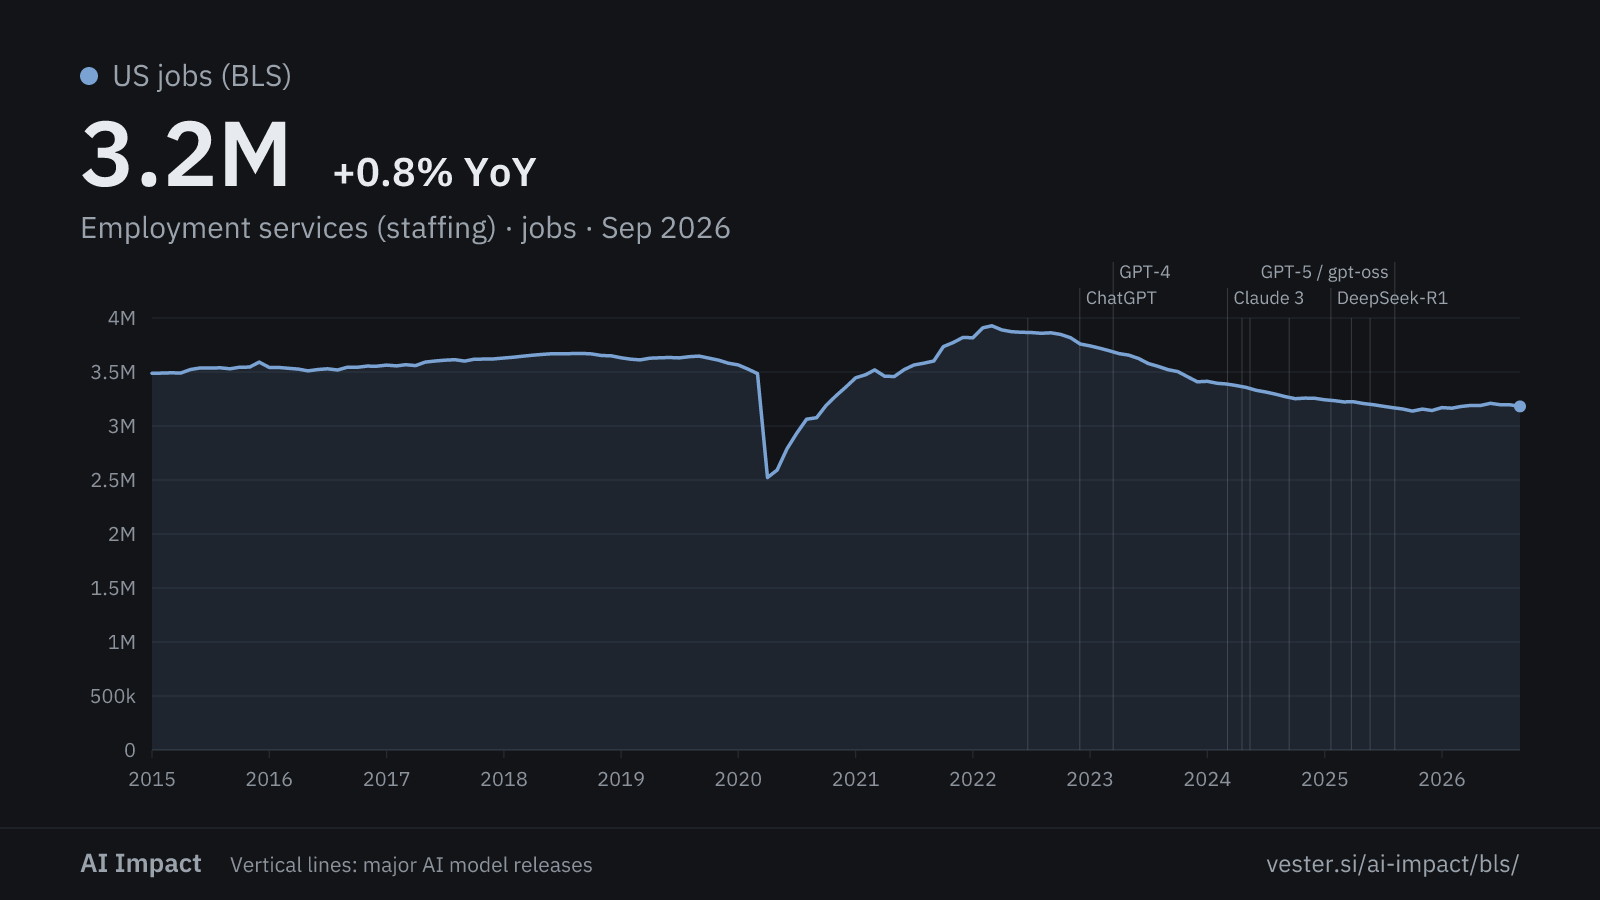
Employment services (staffing)
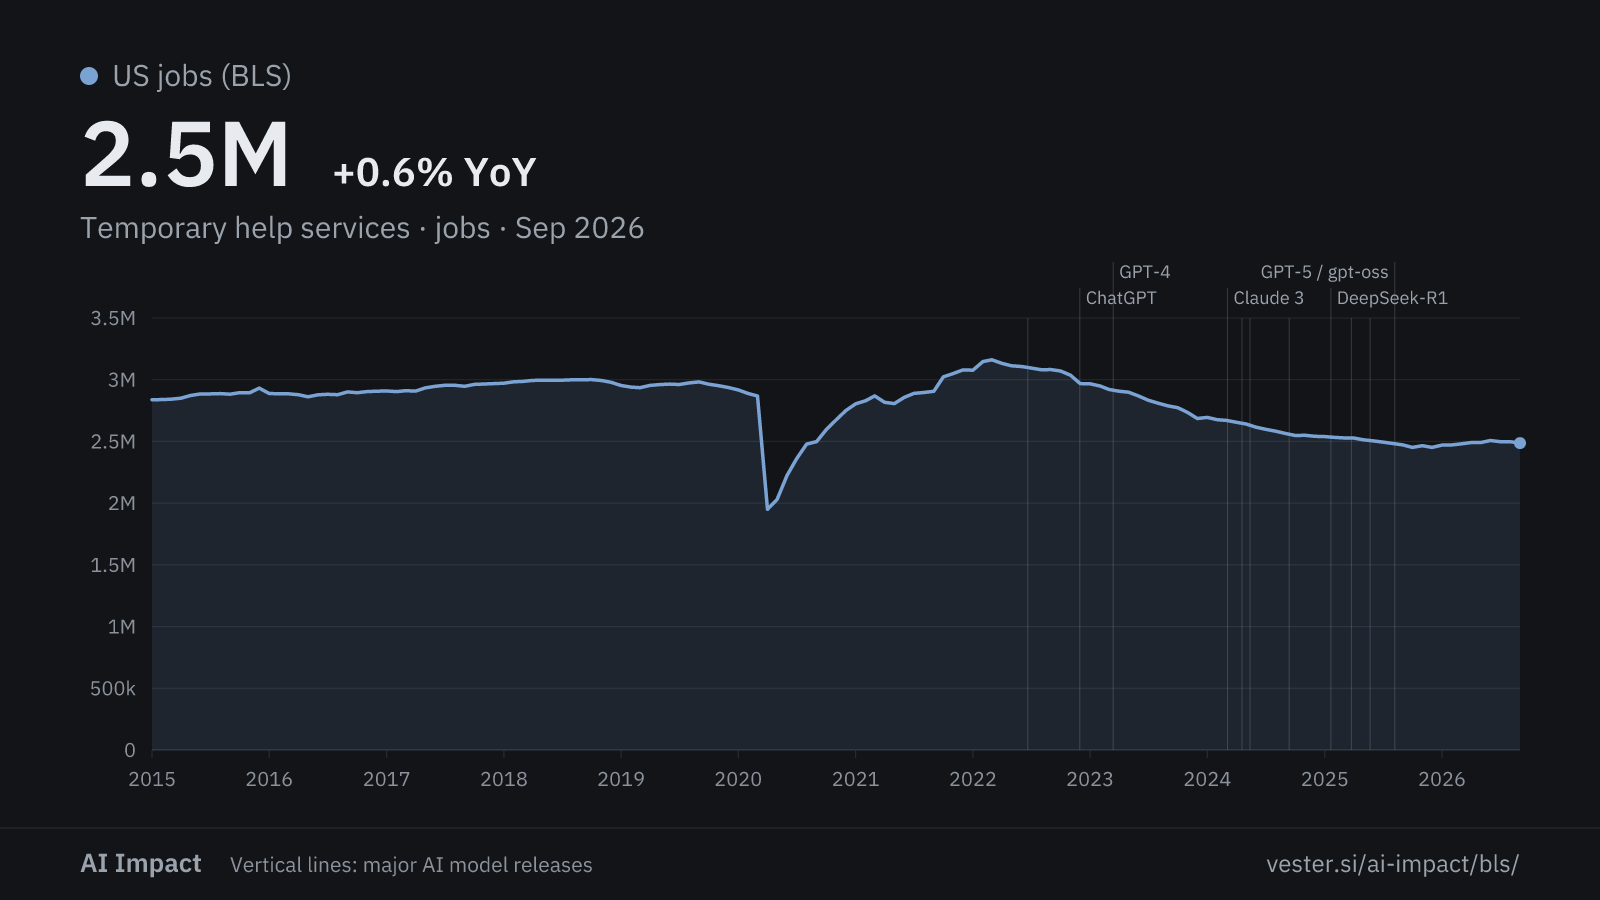
Temporary help services
Derived
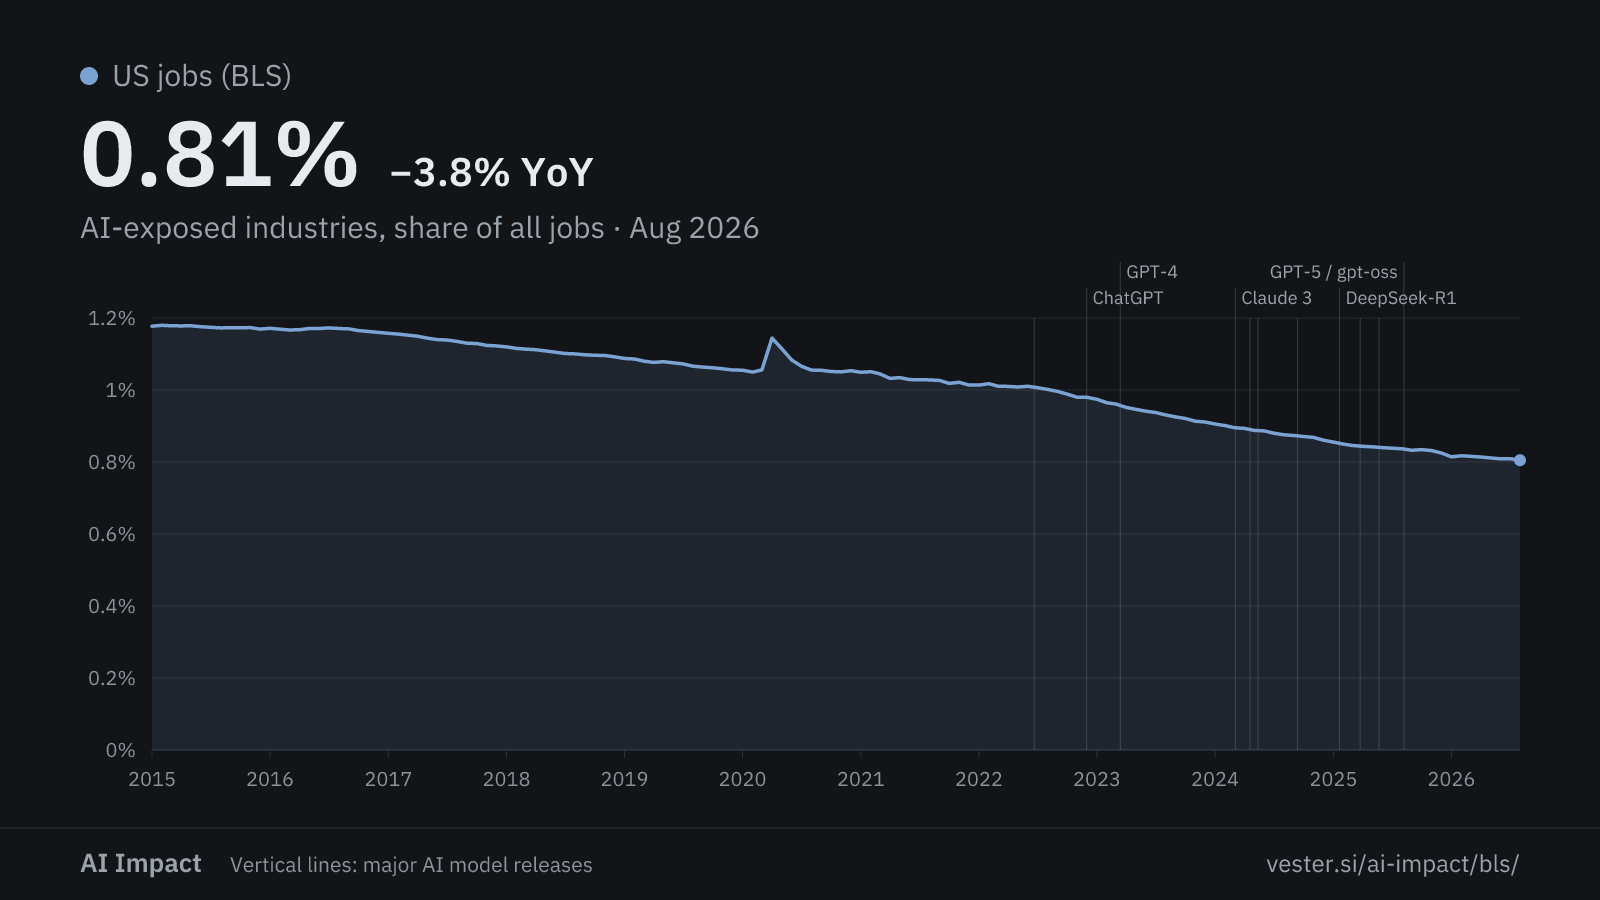
AI-exposed industries, share of all jobs derived
Job openings, hiring & layoffs (JOLTS)
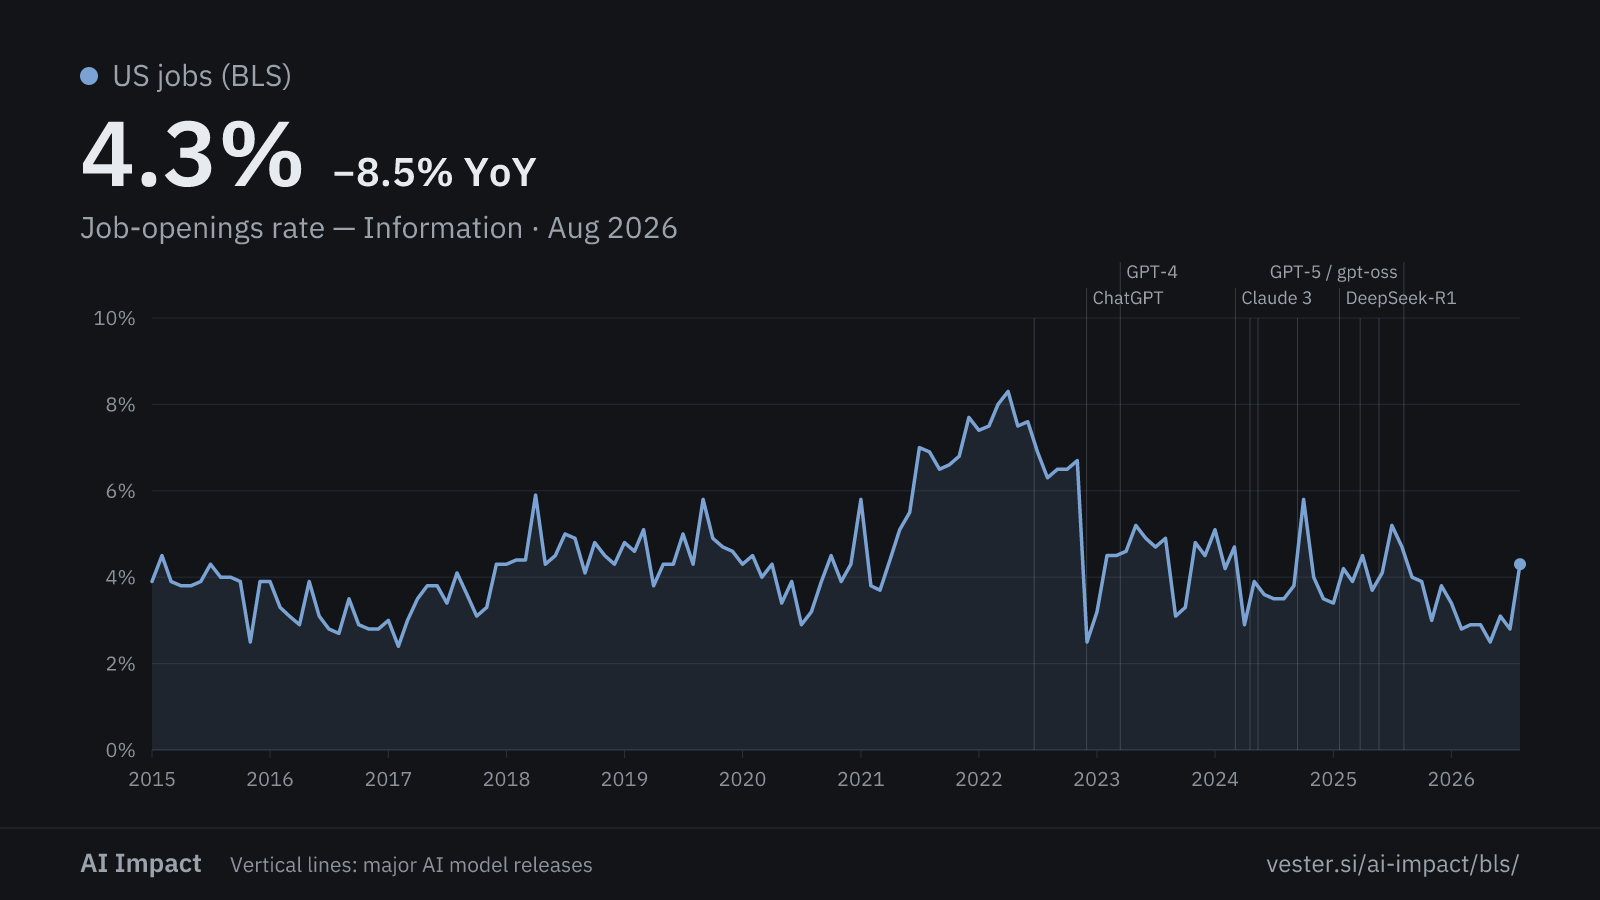
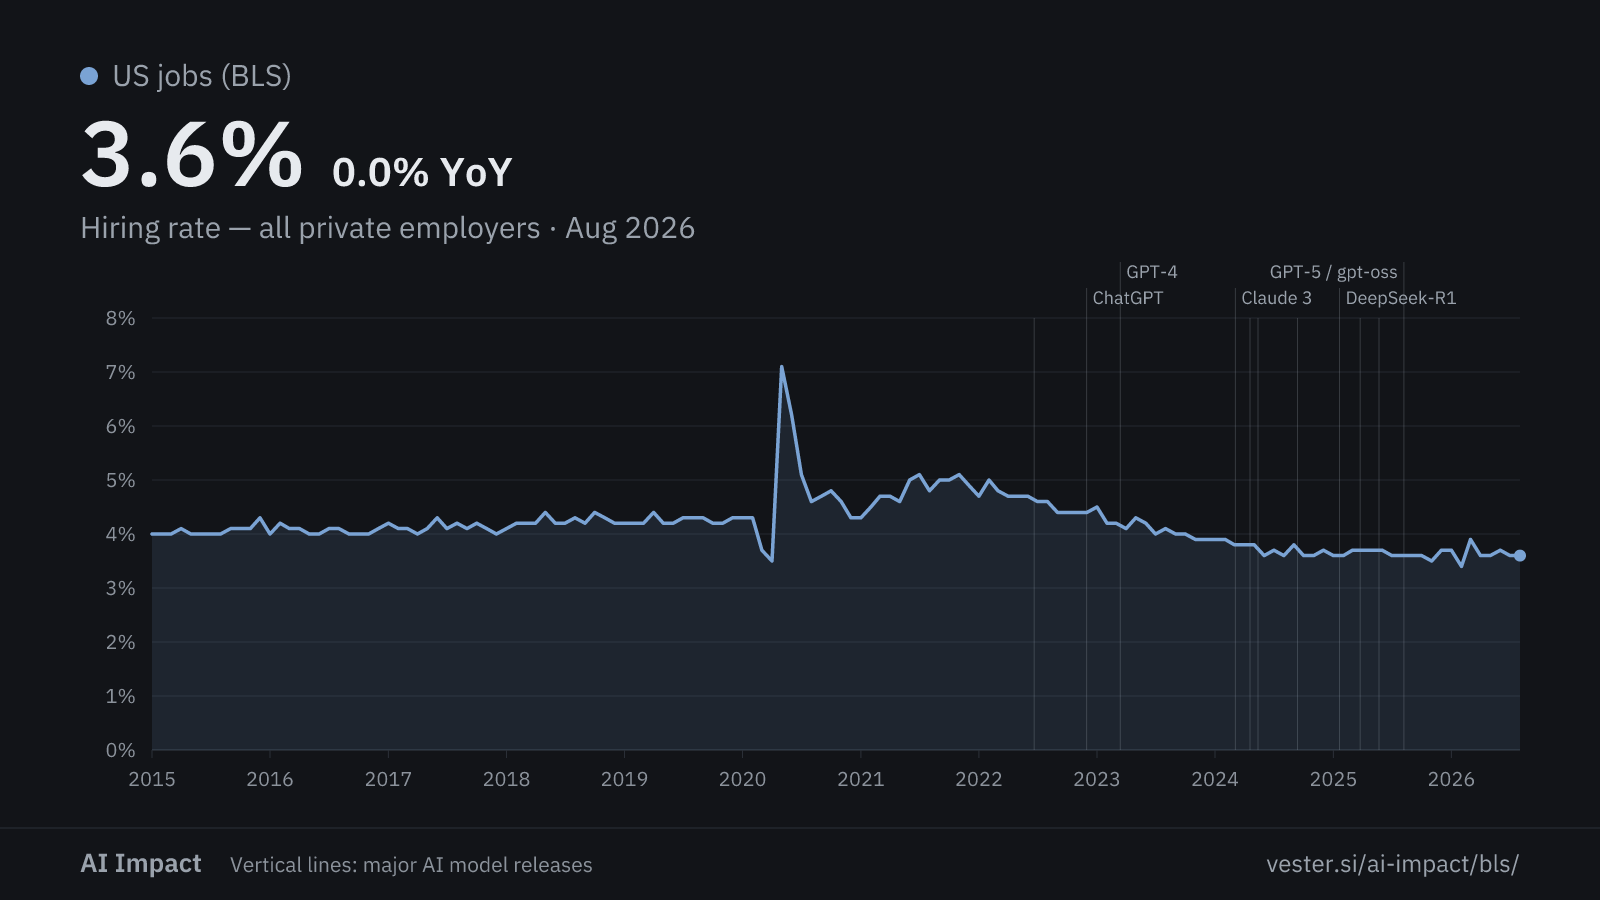
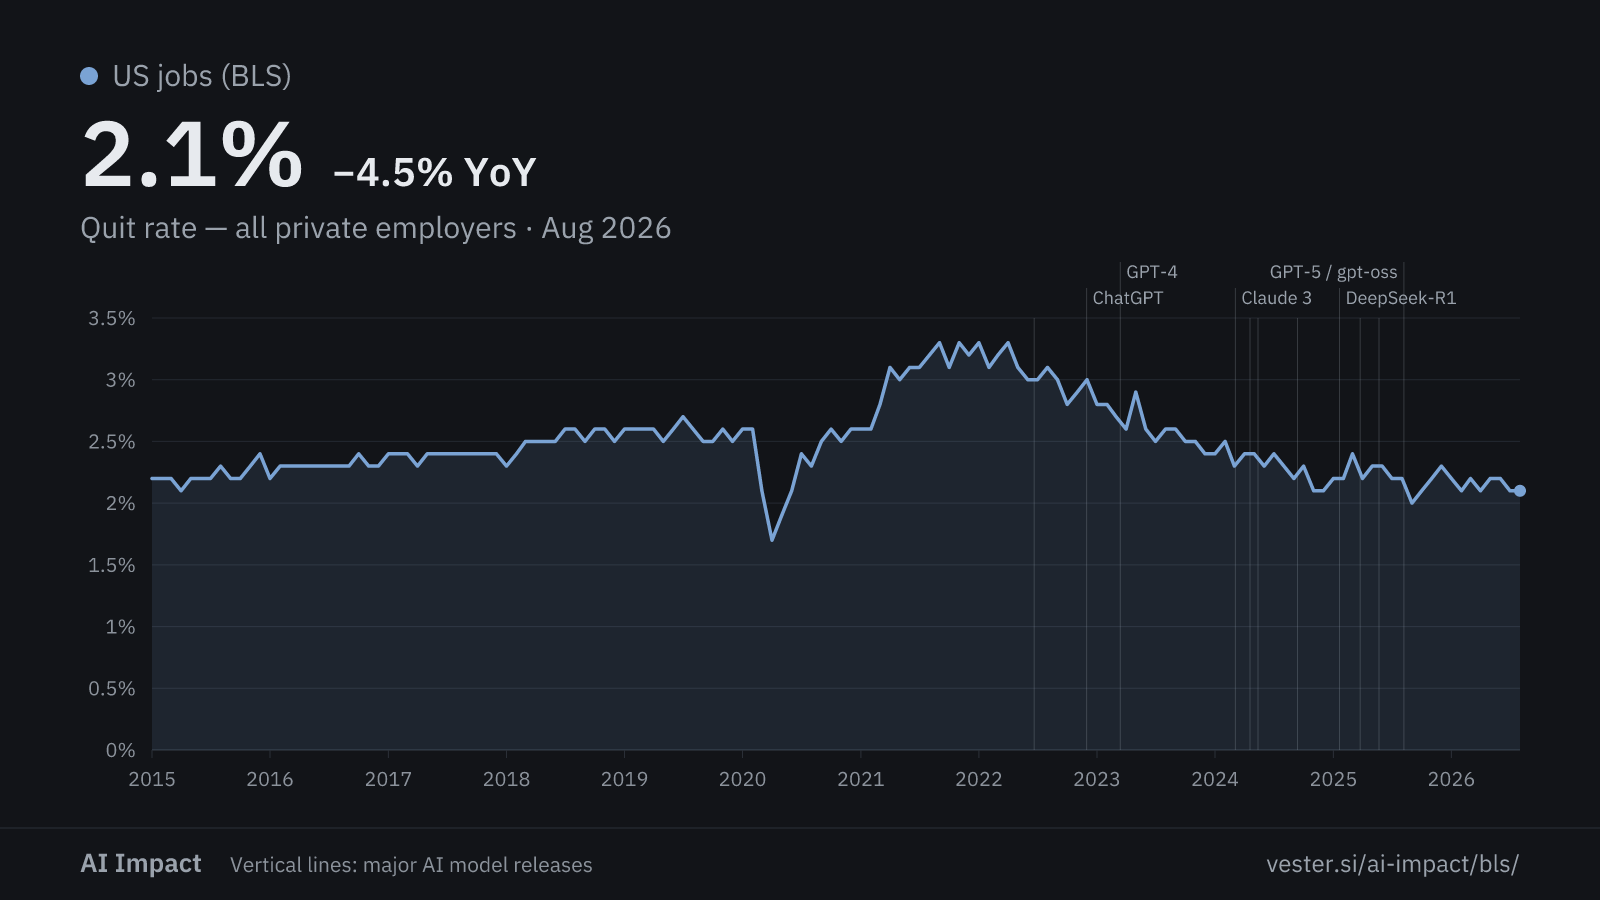
These charts count moves into and out of jobs each month, not the number of jobs. ⚠ Compare each one with 2015–2019, not with the tight job market of 2021 and 2022.
Layoff rate — Information
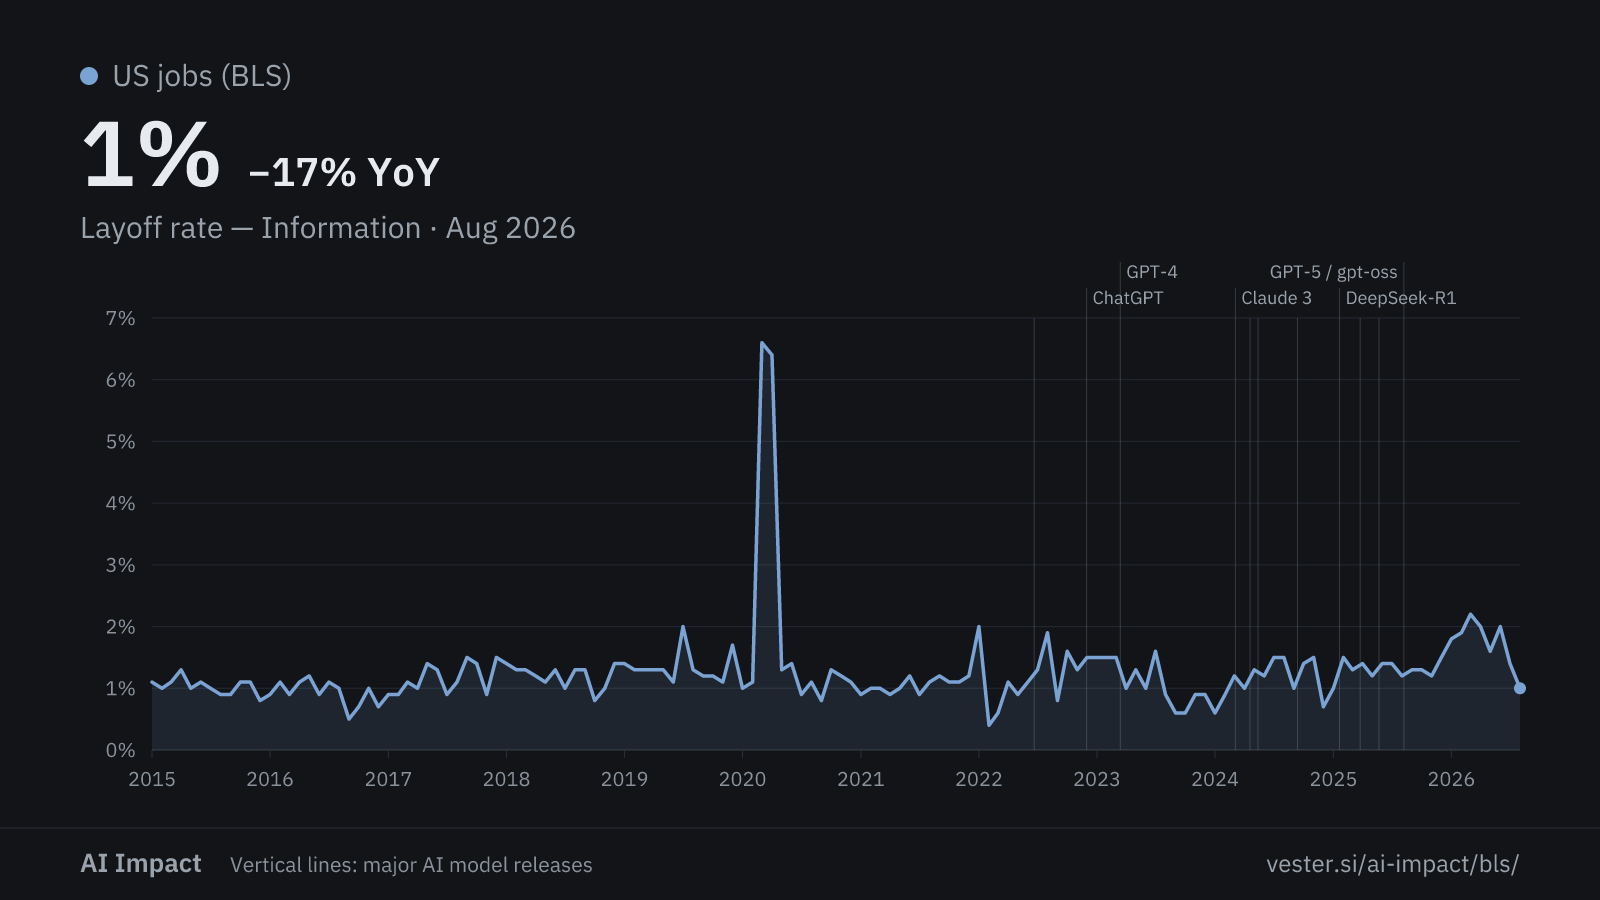
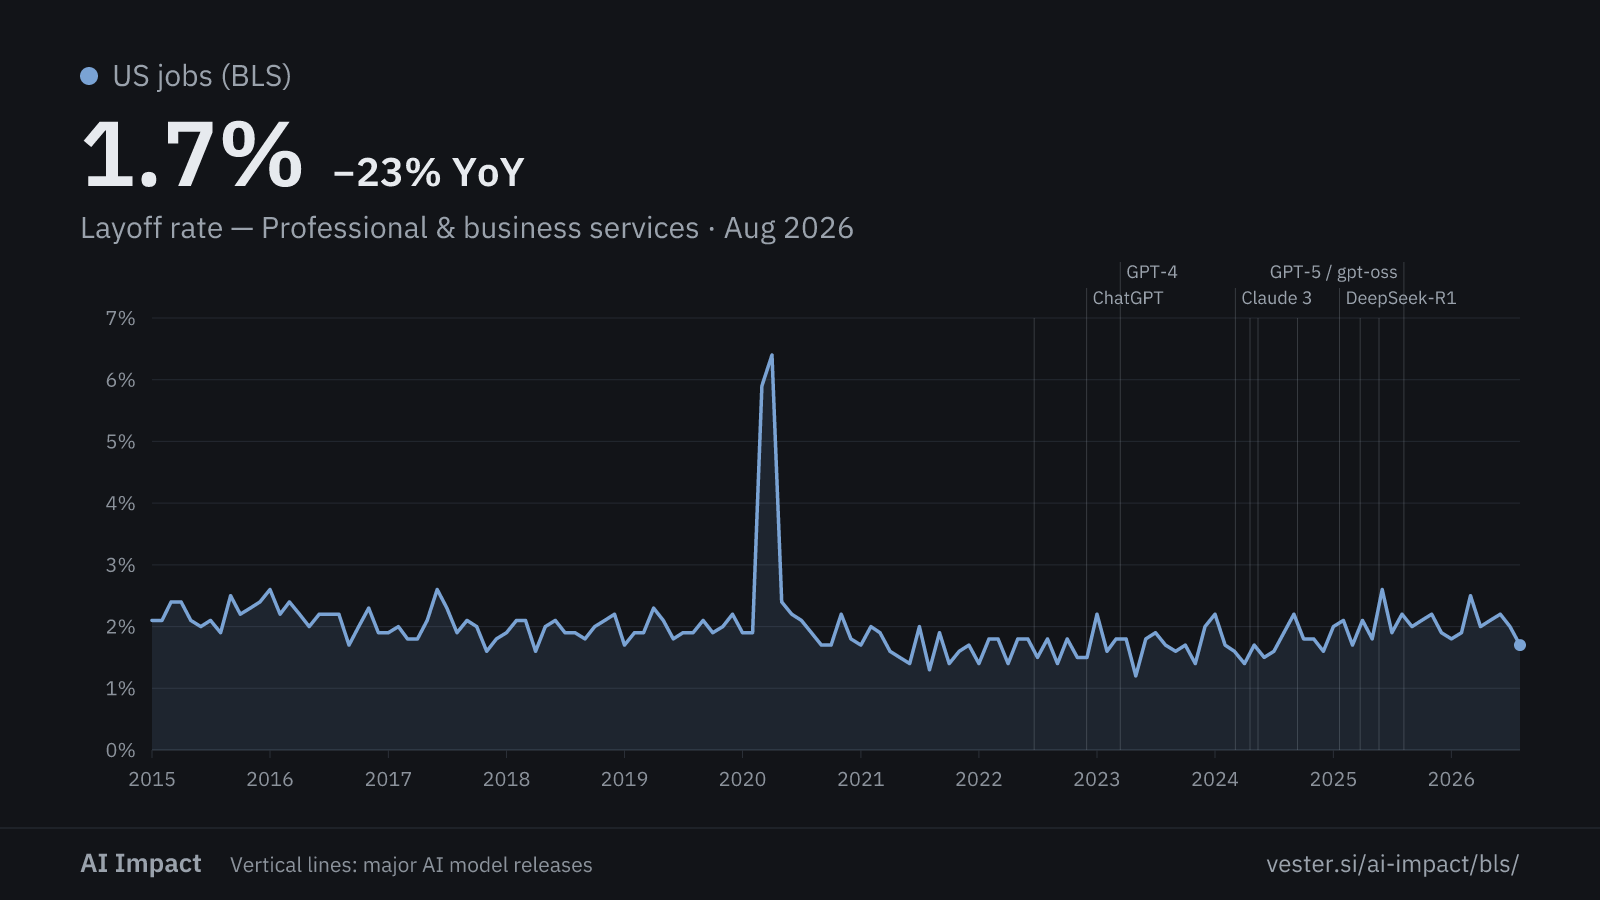
Layoff rate — Professional & business services
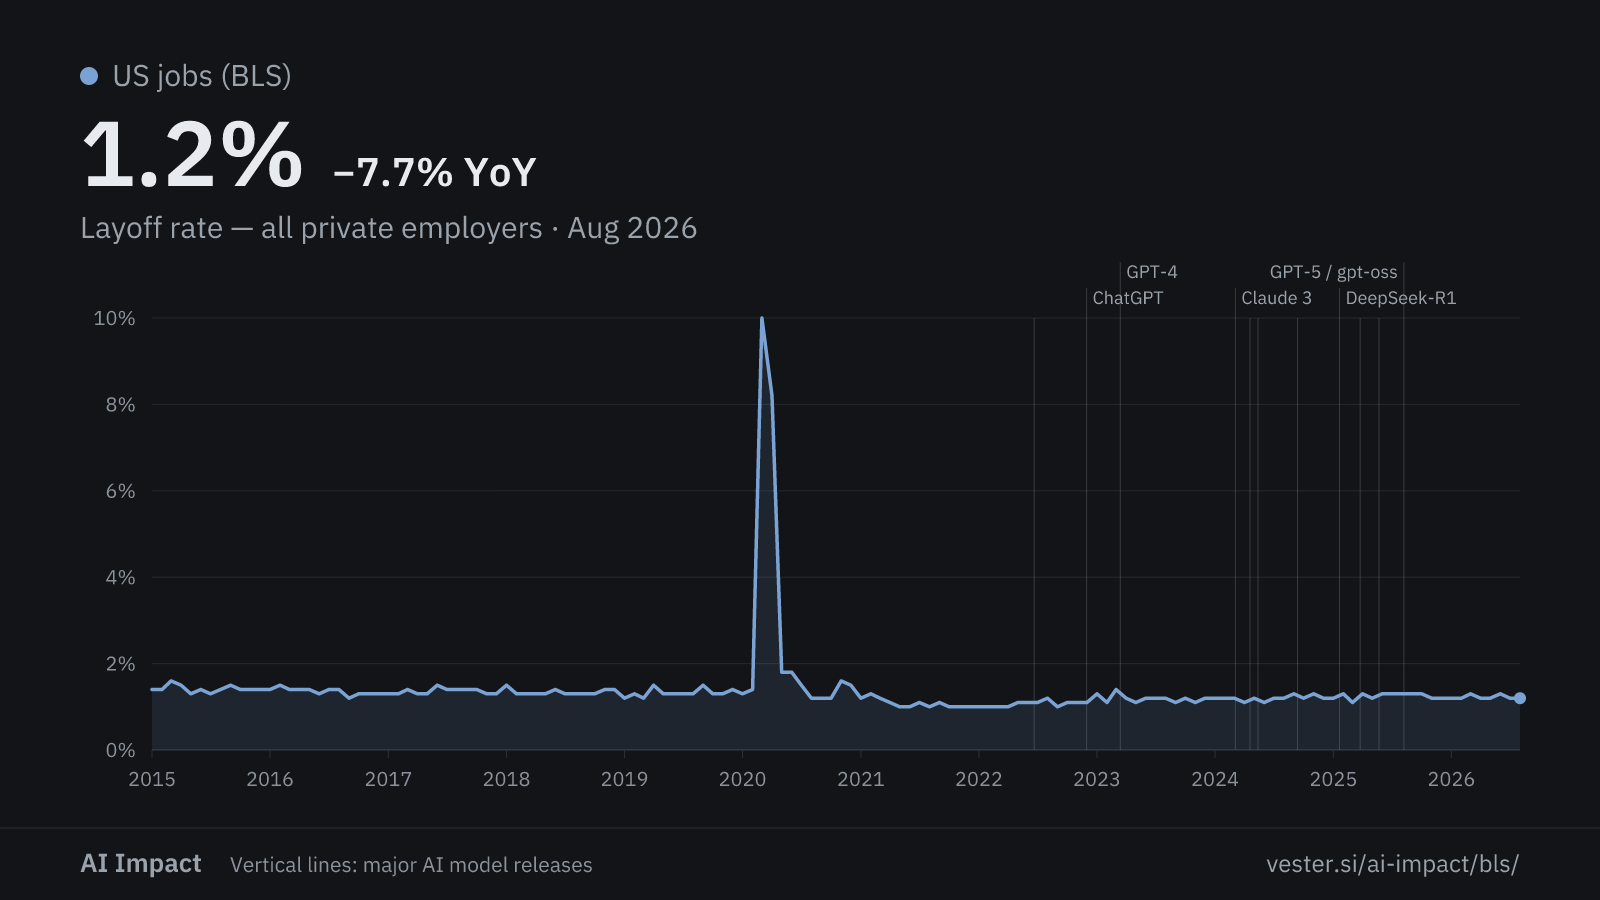
Layoff rate — all private employers
Job-openings rate — Information
Hiring rate — all private employers
Quit rate — all private employers
Figures
| Series | Latest | Change | Min | Max | Coverage |
|---|---|---|---|---|---|
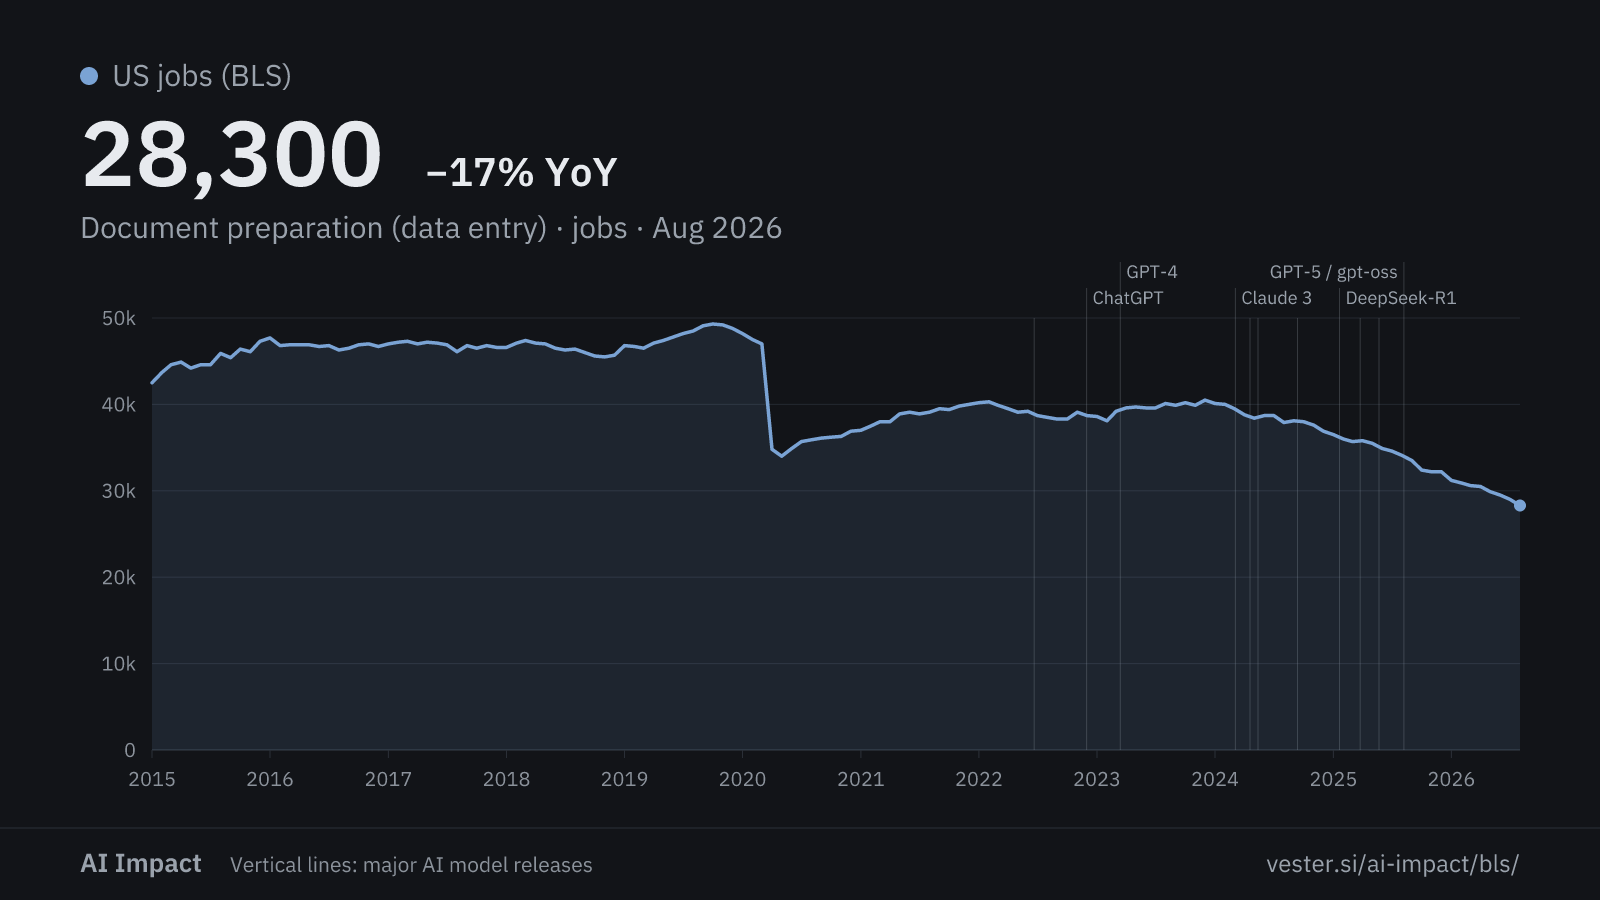
| Call centres & telemarketing | 277k | −3.2% yr | 276k | 505k | Jan 2015 — Aug 2026 |
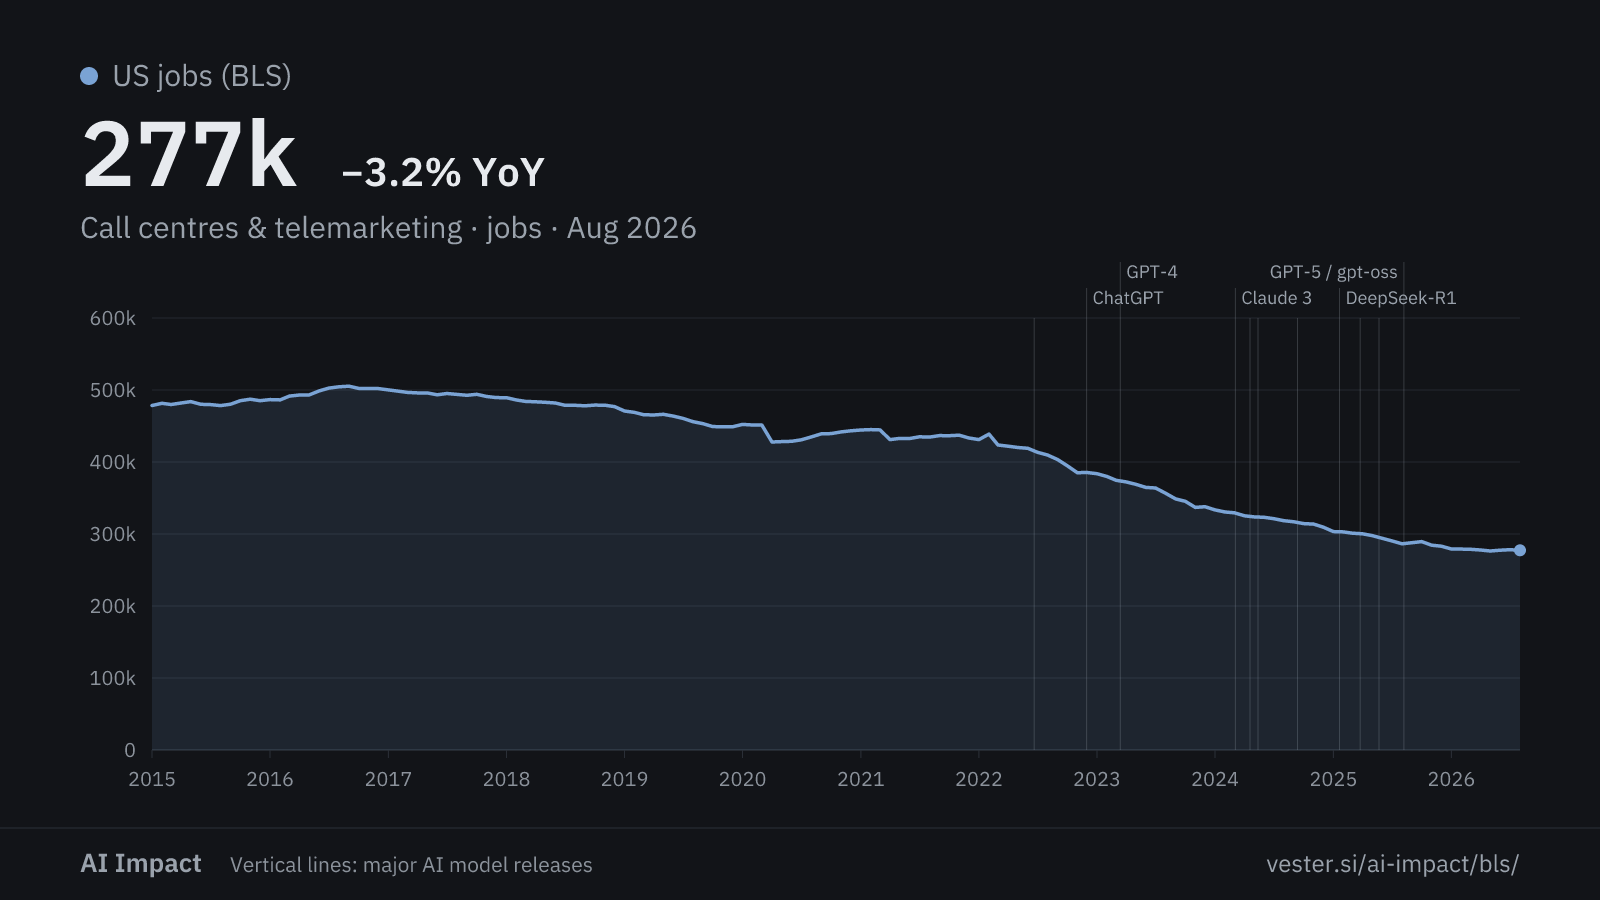
| Telephone call centres (all) | 307k | −4.1% yr | 307k | 542k | Jan 2015 — Aug 2026 |
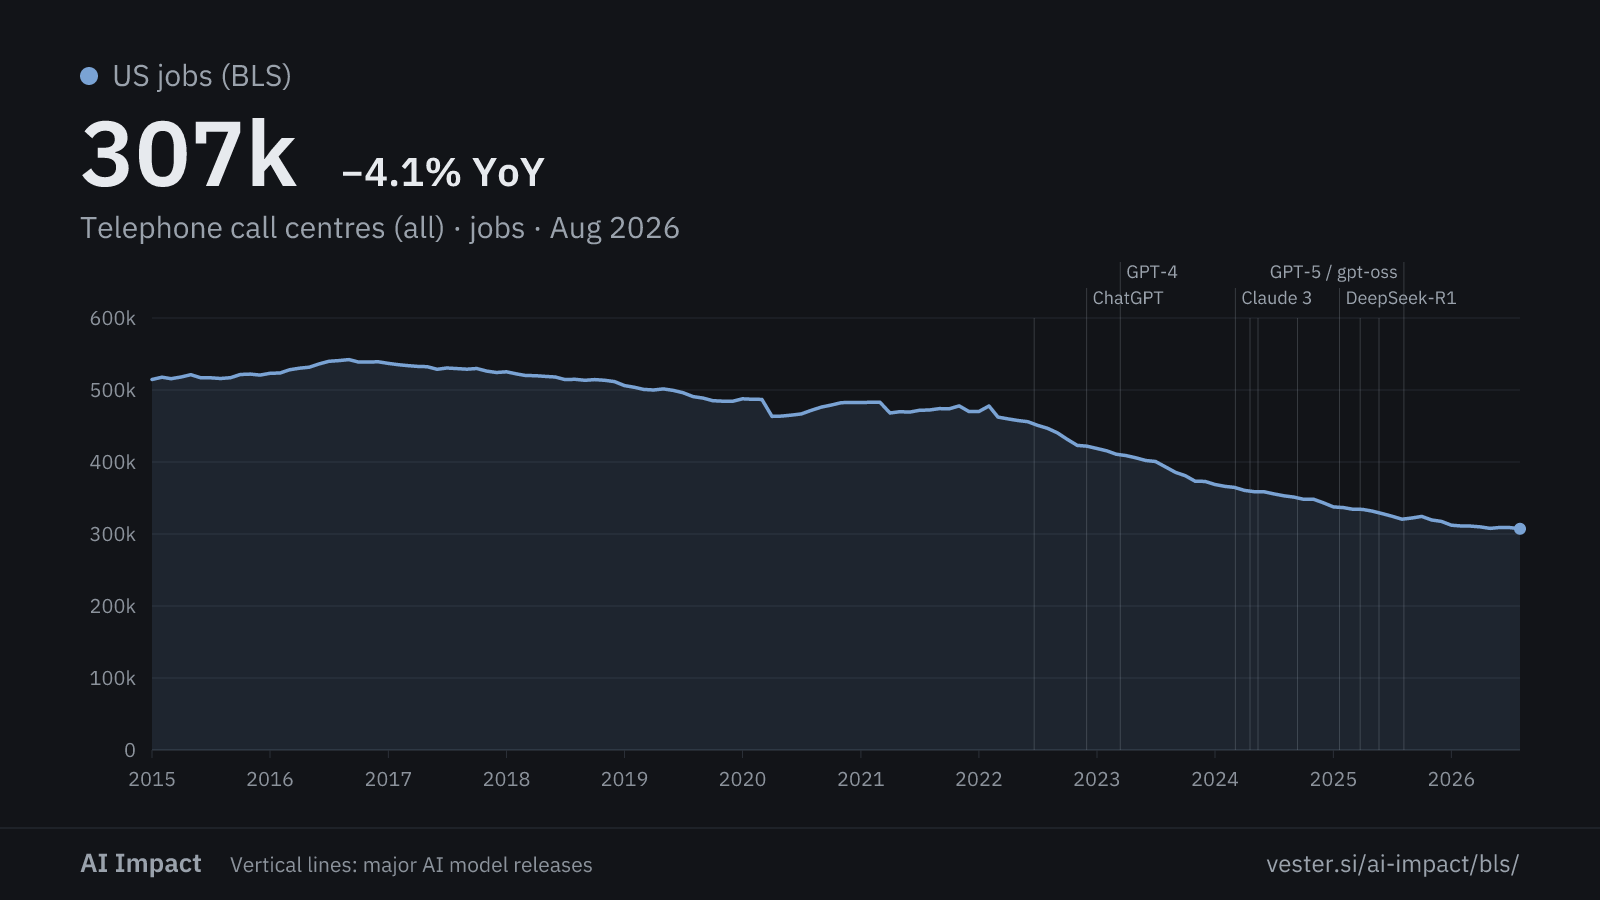
| Document preparation (data entry) | 28.3k | −17.0% yr | 28.3k | 49.3k | Jan 2015 — Aug 2026 |
| Graphic design services | 51.8k | +1.8% yr | 50.1k | 65.0k | Jan 2015 — Aug 2026 |
| Newspaper, book & periodical publishers | 233k | −7.9% yr | 233k | 438k | Jan 2015 — Aug 2026 |
| Web portals & other information services | 183k | +0.1% yr | 121k | 192k | Jan 2015 — Sep 2026 |
| Advertising & public relations | 479k | −0.6% yr | 433k | 503k | Jan 2015 — Sep 2026 |
| Computer systems design & services | 2.4M | −1.3% yr | 1.9M | 2.5M | Jan 2015 — Sep 2026 |
| Custom computer programming | 1.1M | −0.8% yr | 806k | 1.1M | Jan 2015 — Aug 2026 |
| Computer systems design | 1.1M | −2.3% yr | 890k | 1.2M | Jan 2015 — Aug 2026 |
| Software publishers | 653k | −0.5% yr | 326k | 664k | Jan 2015 — Aug 2026 |
| Data centres, hosting & data processing | 454k | −4.7% yr | 291k | 489k | Jan 2015 — Sep 2026 |
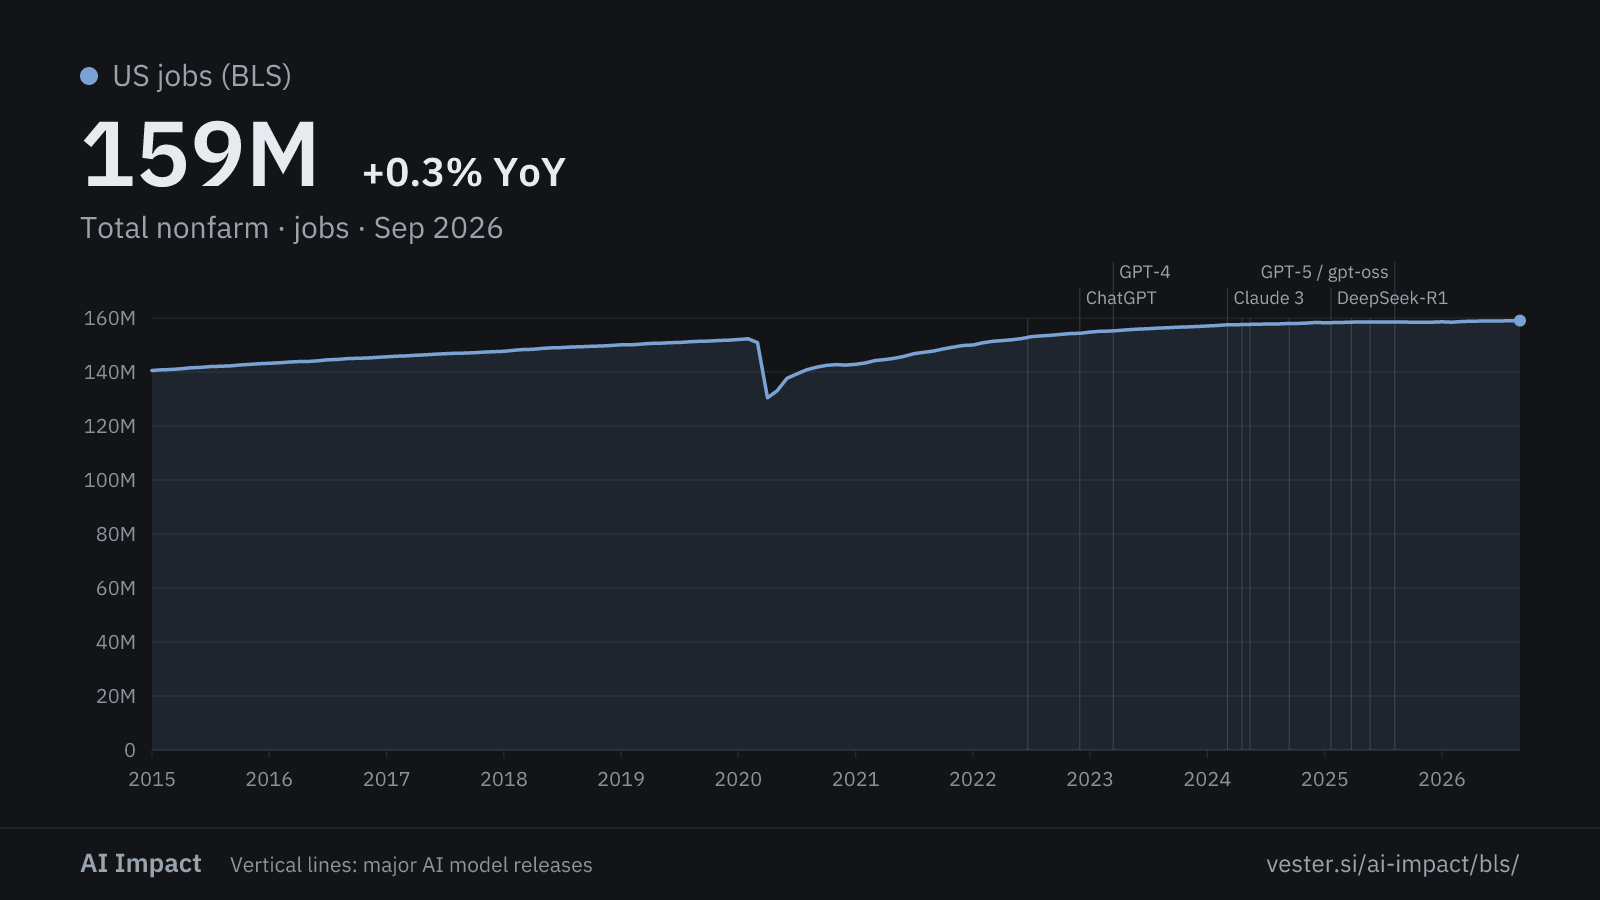
| Total nonfarm (all jobs) | 159M | +0.3% yr | 130M | 159M | Jan 2015 — Sep 2026 |
| Total private | 136M | +0.5% yr | 109M | 136M | Jan 2015 — Sep 2026 |
| Professional & business services | 22.5M | +0.6% yr | 19.2M | 22.9M | Jan 2015 — Sep 2026 |
| Professional, scientific & technical | 10.8M | +0.8% yr | 8.5M | 10.8M | Jan 2015 — Sep 2026 |
| Administrative & support services | 8.5M | +0.5% yr | 7.2M | 9.1M | Jan 2015 — Sep 2026 |
| Information sector | 2.7M | −4.2% yr | 2.6M | 3.1M | Jan 2015 — Sep 2026 |
| Employment services (staffing) | 3.2M | +0.8% yr | 2.5M | 3.9M | Jan 2015 — Sep 2026 |
| Temporary help services | 2.5M | +0.6% yr | 2.0M | 3.2M | Jan 2015 — Sep 2026 |
| AI-exposed industries, share of all jobs | 0.81% | −3.8% yr | 0.81% | 1.2% | Jan 2015 — Aug 2026 |
| Layoff rate — Information | 1% | −16.7% yr | 0.4% | 6.6% | Jan 2015 — Aug 2026 |
| Layoff rate — Professional & business services | 1.7% | −22.7% yr | 1.2% | 6.4% | Jan 2015 — Aug 2026 |
| Layoff rate — all private employers | 1.2% | −7.7% yr | 1% | 10% | Jan 2015 — Aug 2026 |
| Job-openings rate — Information | 4.3% | −8.5% yr | 2.4% | 8.3% | Jan 2015 — Aug 2026 |
| Hiring rate — all private employers | 3.6% | 0.0% yr | 3.4% | 7.1% | Jan 2015 — Aug 2026 |
| Quit rate — all private employers | 2.1% | −4.5% yr | 1.7% | 3.3% | Jan 2015 — Aug 2026 |