US electricity (EIA)
Monthly US retail electricity sales from EIA Form EIA-861M since 2010: commercial-sector sales in Virginia, Ohio, Georgia, Arizona, New York, California and the whole US; the all-sector total of each of those states; and derived series for Virginia's share of US commercial sales and for sales per commercial customer.
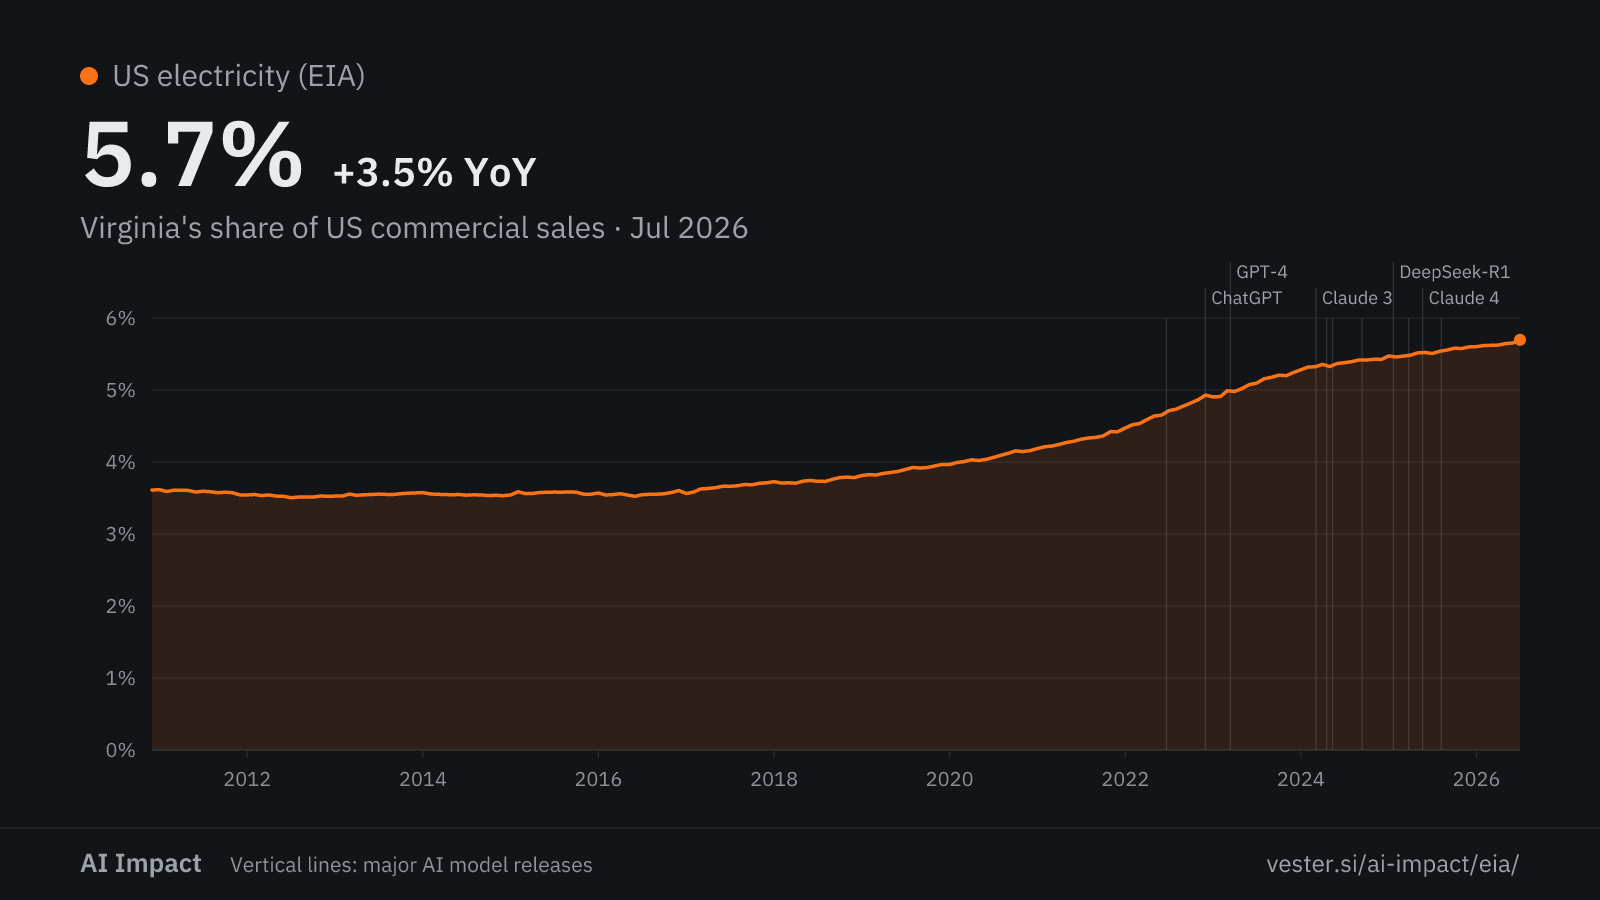
Data centres pay commercial electricity rates, but so does every shop and office. No chart here counts data centres alone. ⚠ Virginia's growth starts in 2021, before ChatGPT: cloud computing and AI both drive it, and this data cannot separate them.
Commercial electricity sales
Virginia
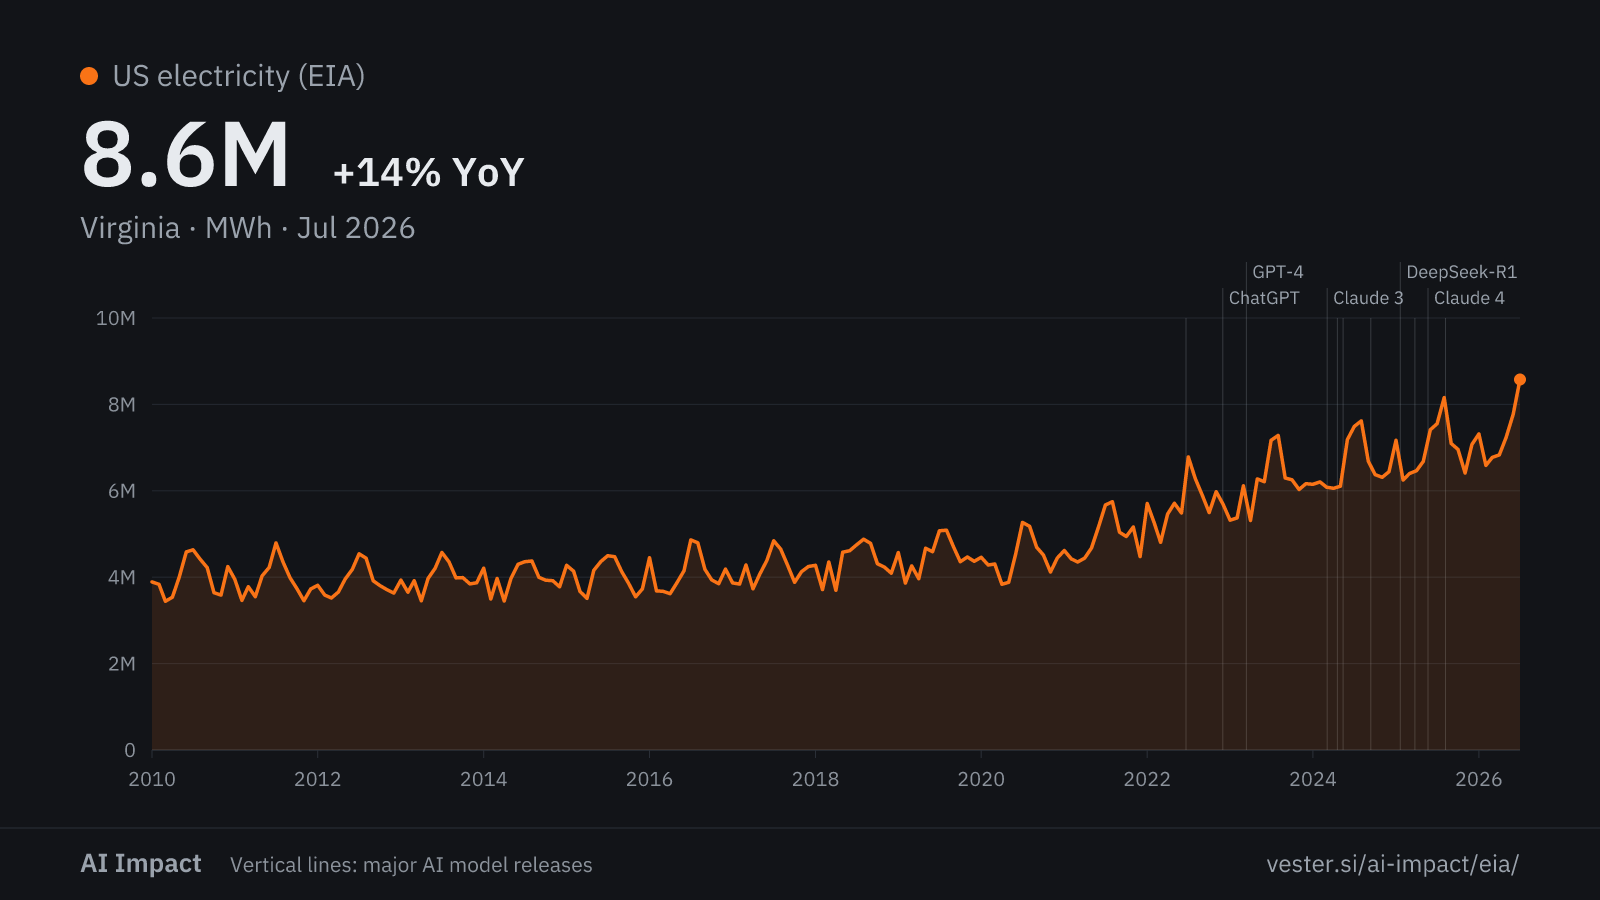
8.6M MWh +13.6% yr as of Jul 2026
Ohio
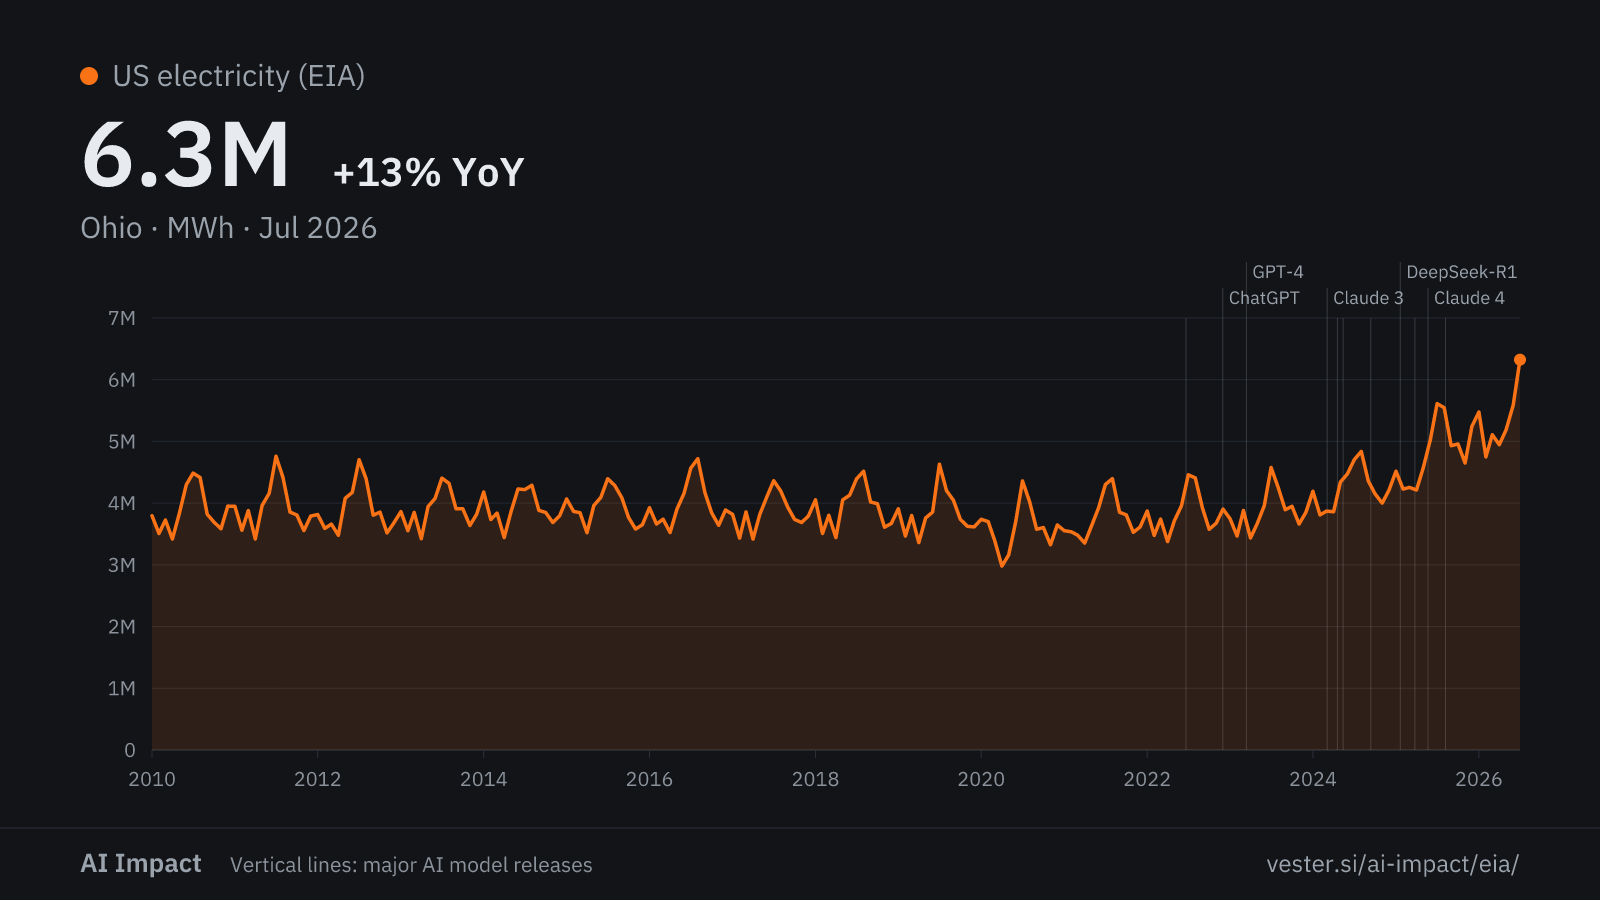
6.3M MWh +12.7% yr as of Jul 2026
Georgia
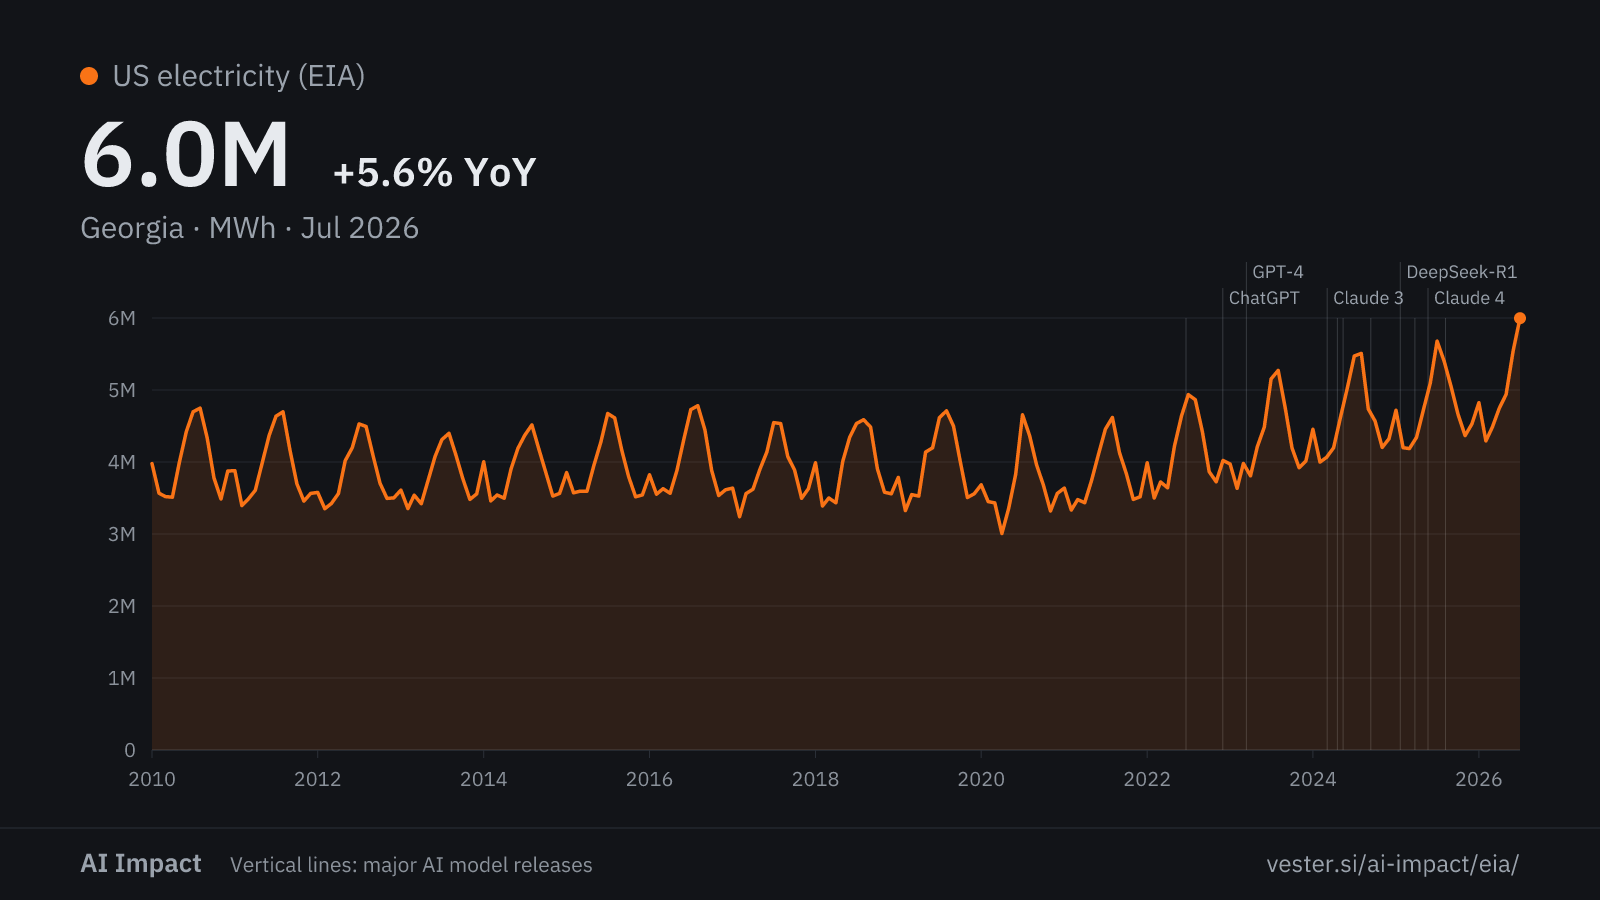
6.0M MWh +5.6% yr as of Jul 2026
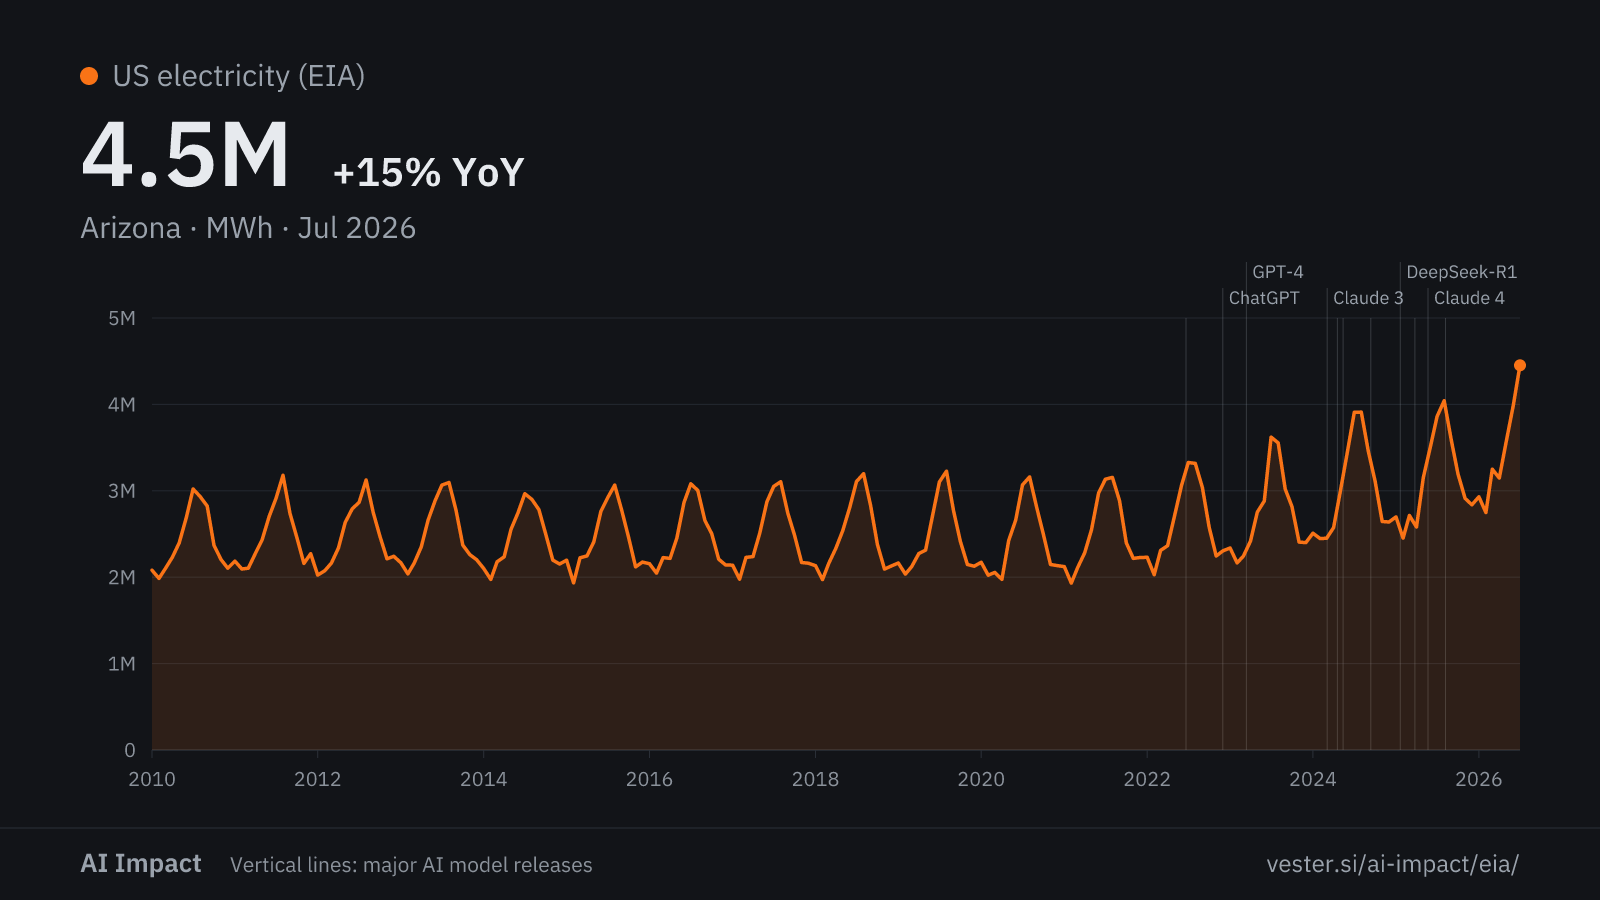
Arizona
4.5M MWh +15.3% yr as of Jul 2026
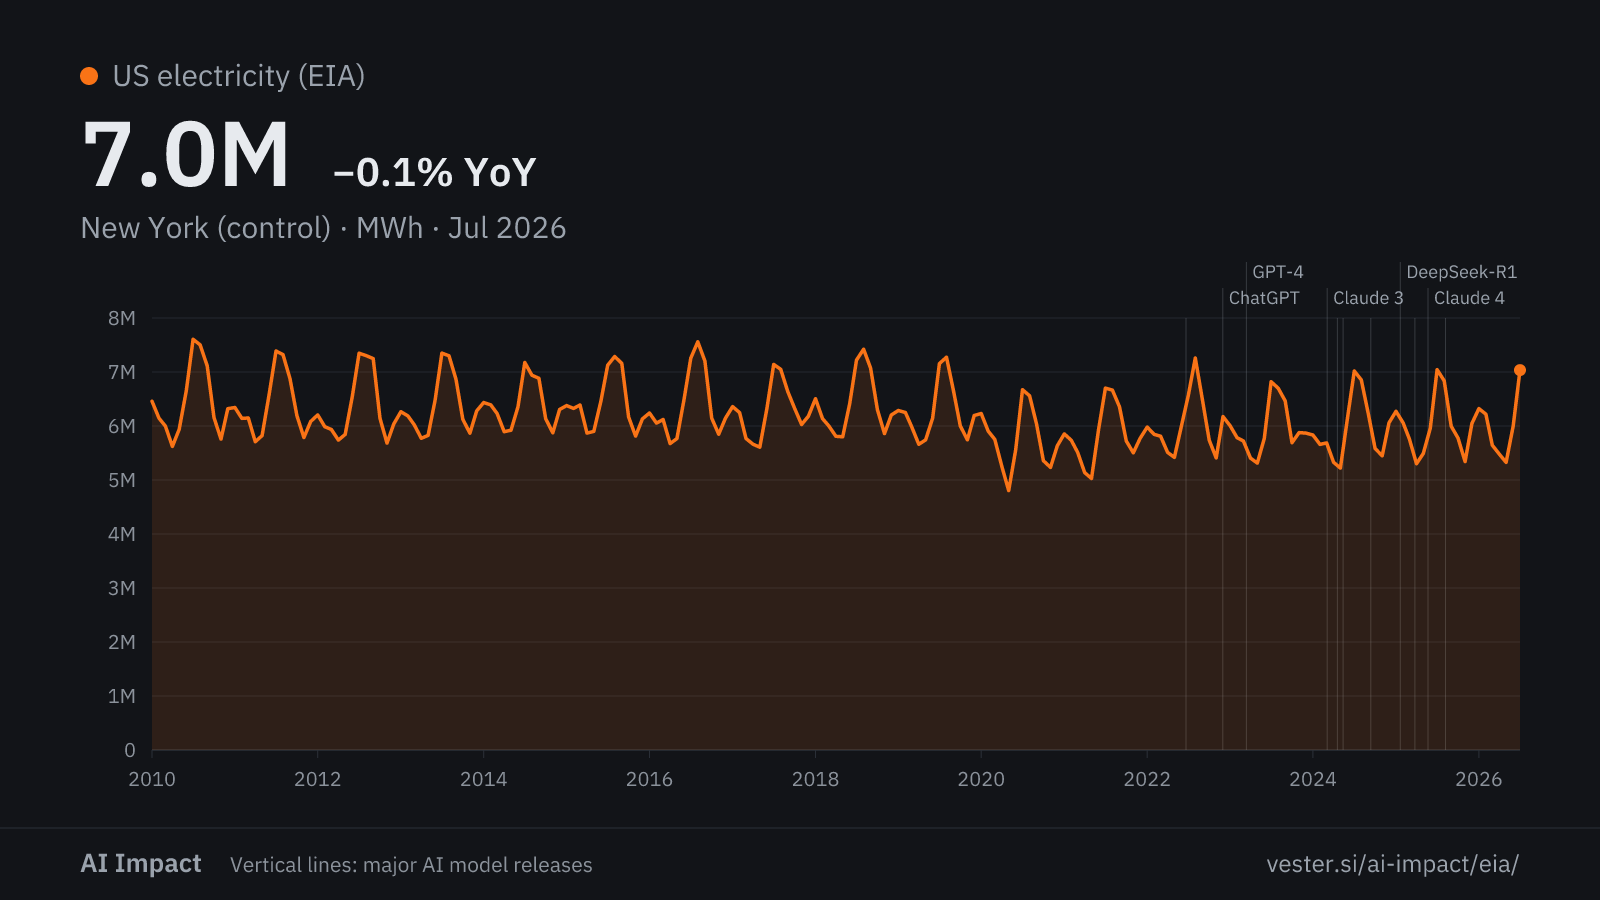
New York (control)
7.0M MWh −0.1% yr as of Jul 2026
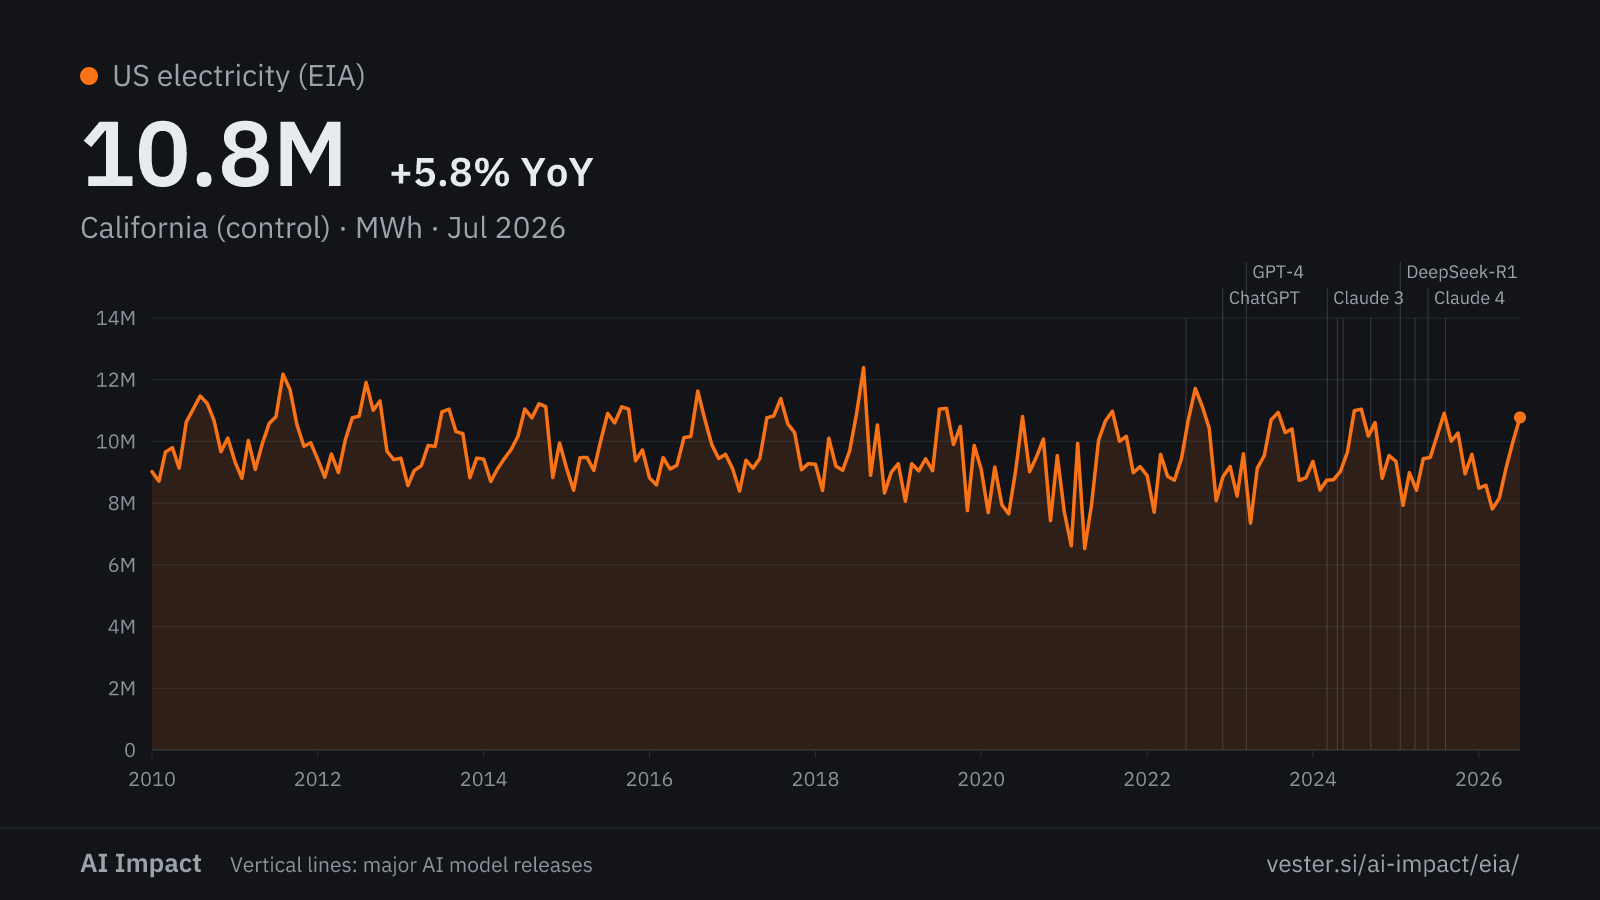
California (control)
10.8M MWh +5.8% yr as of Jul 2026
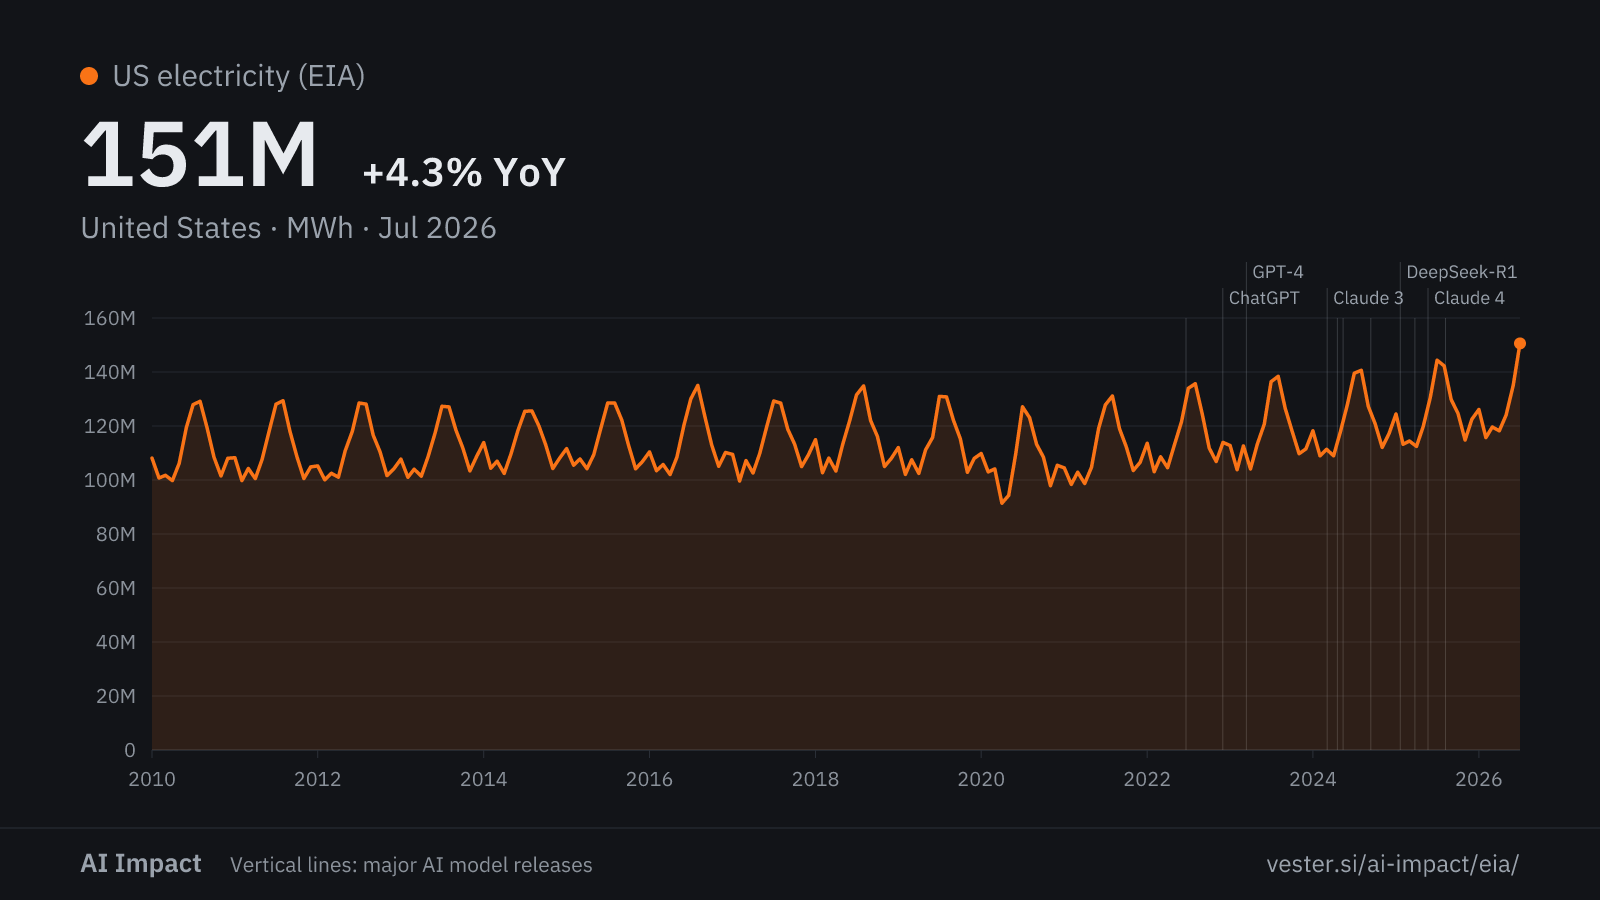
United States
151M MWh +4.3% yr as of Jul 2026
All-sector totals
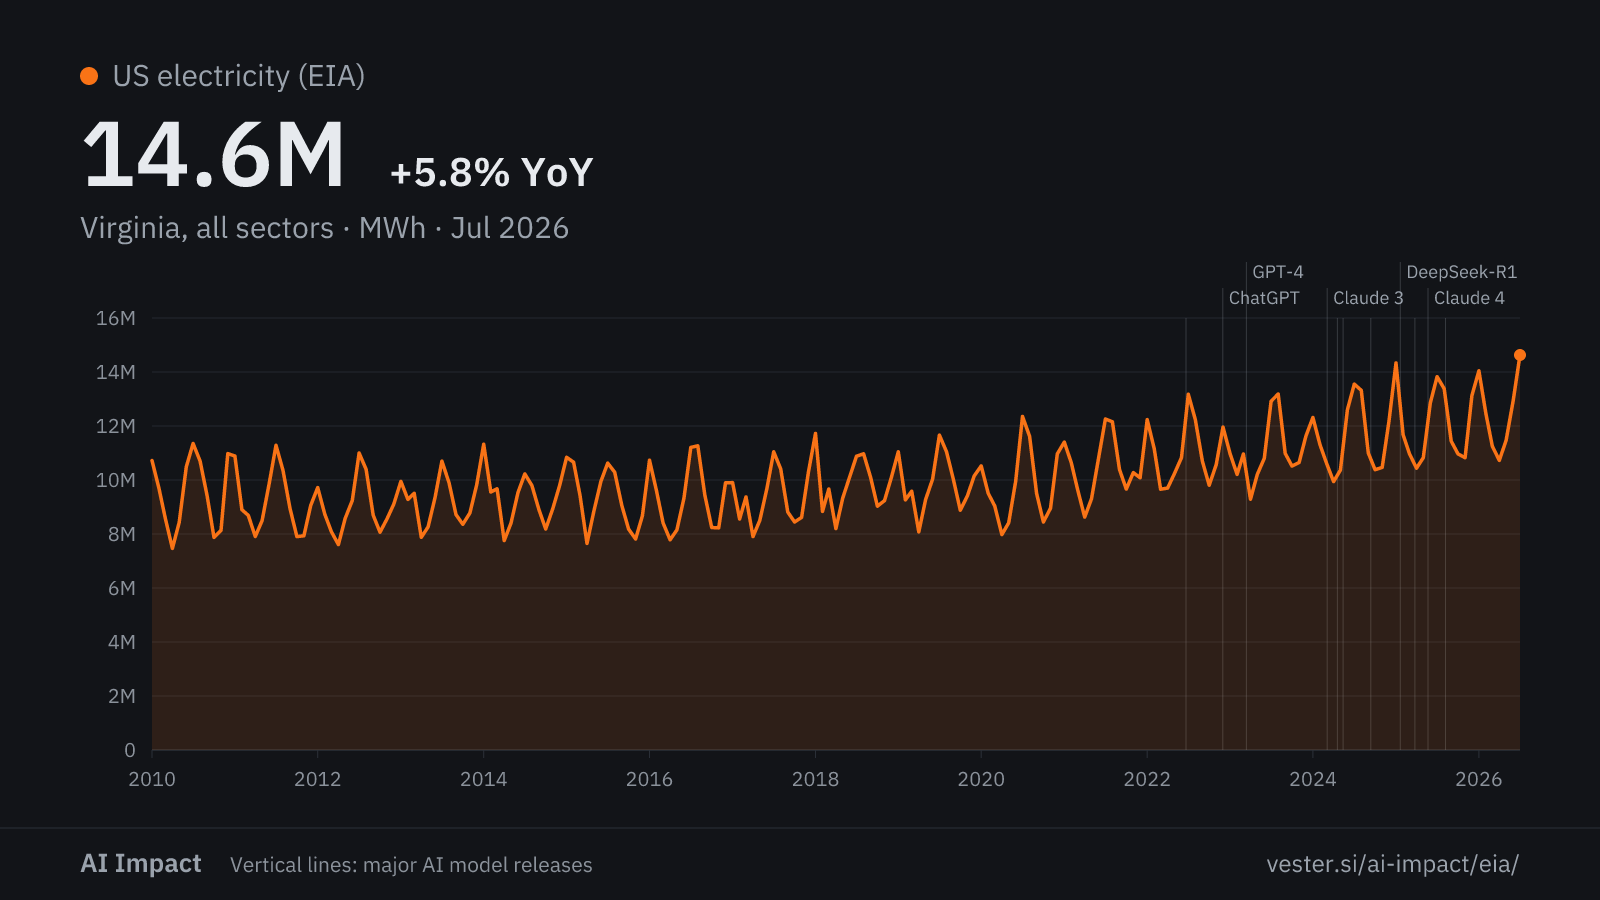
Each chart here adds all five sectors. If commercial sales rise but the total does not, a utility only moved customers between billing classes.
Virginia, all sectors
14.6M MWh +5.8% yr as of Jul 2026
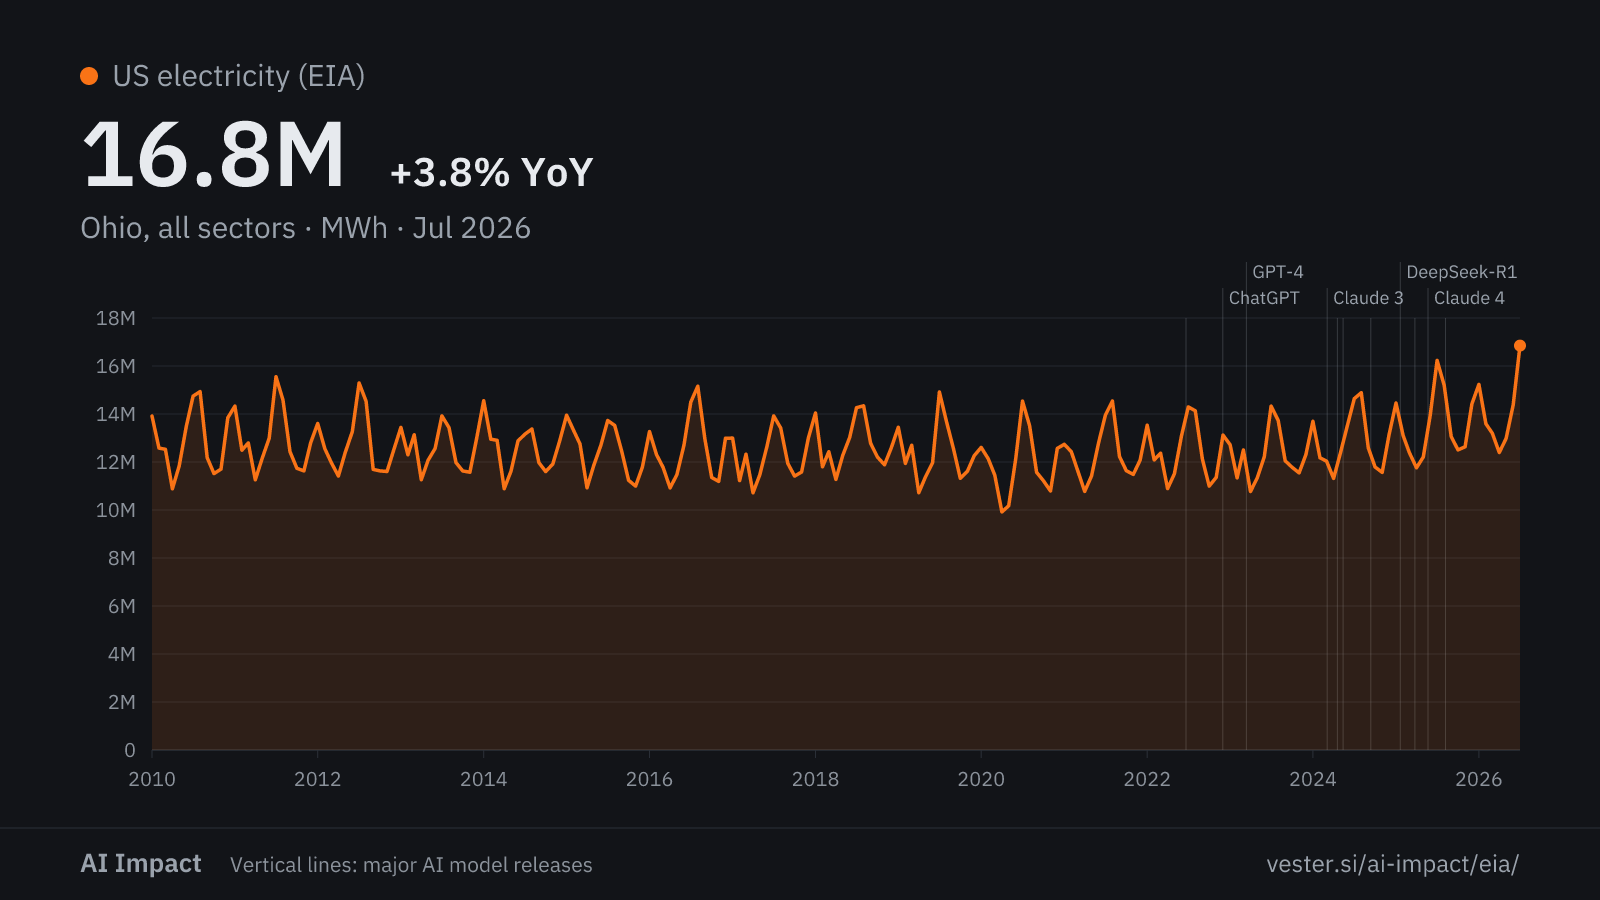
Ohio, all sectors
16.8M MWh +3.8% yr as of Jul 2026
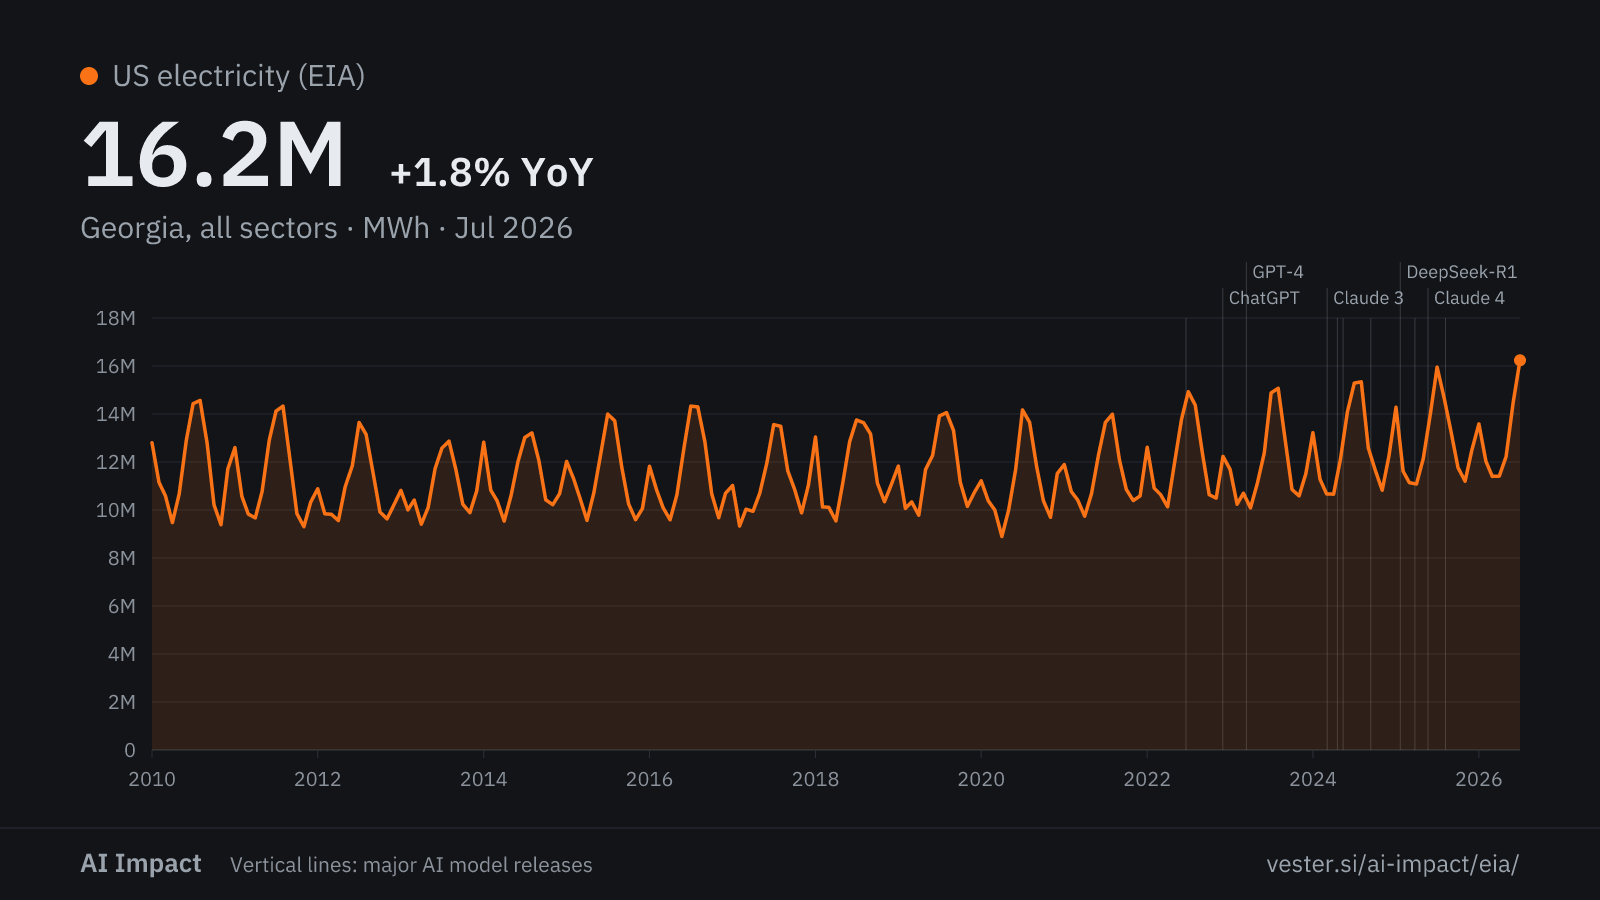
Georgia, all sectors
16.2M MWh +1.8% yr as of Jul 2026
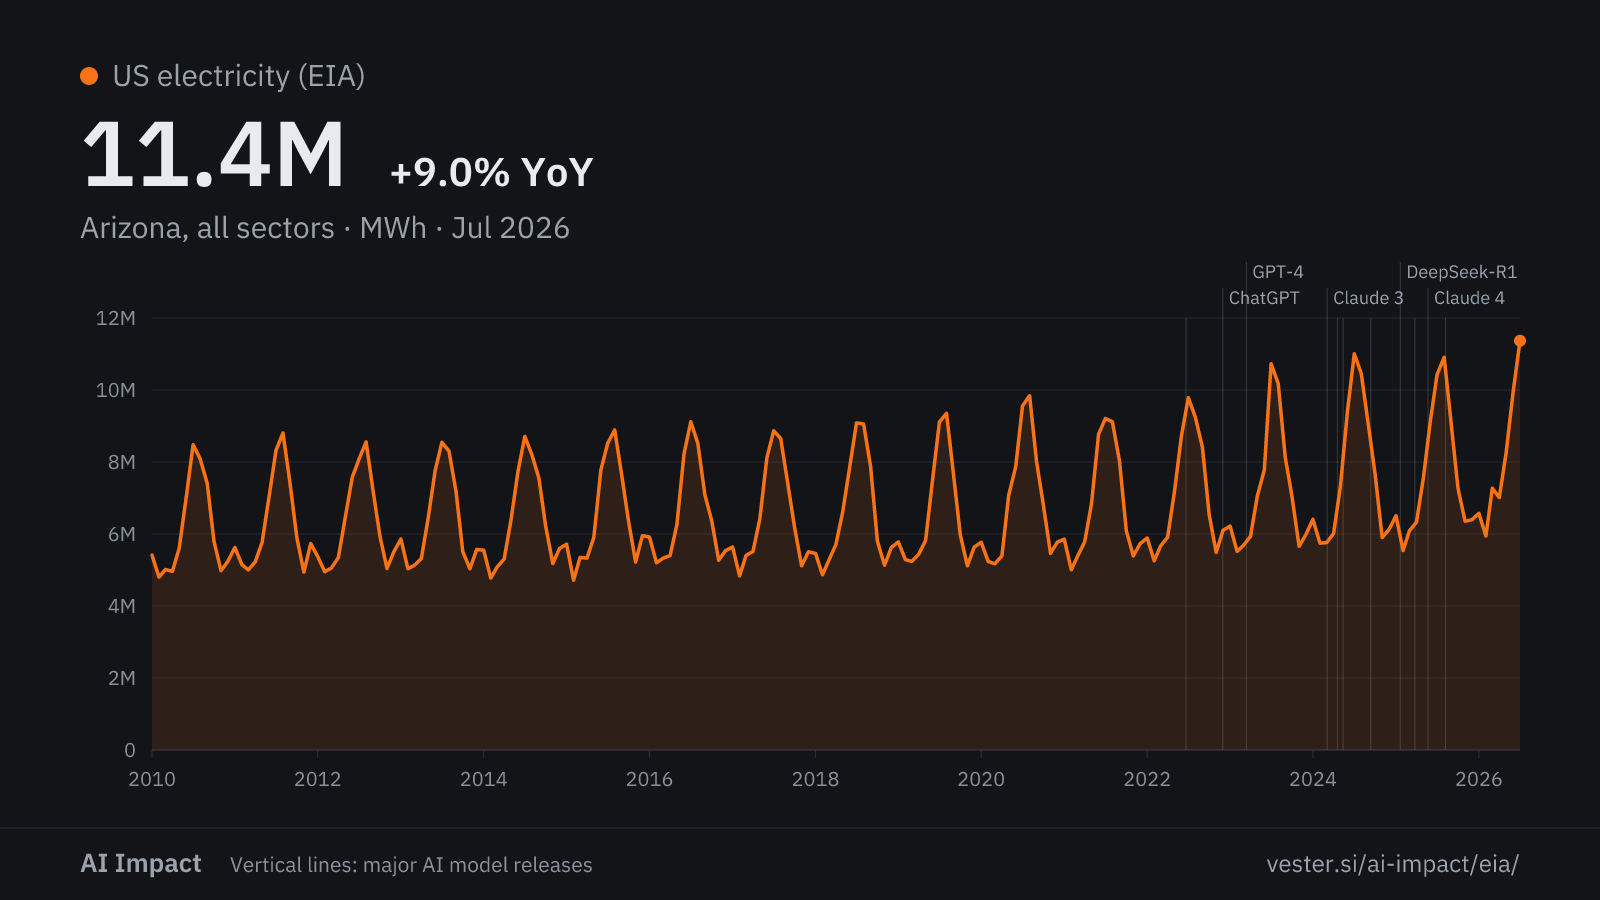
Arizona, all sectors
11.4M MWh +9.0% yr as of Jul 2026
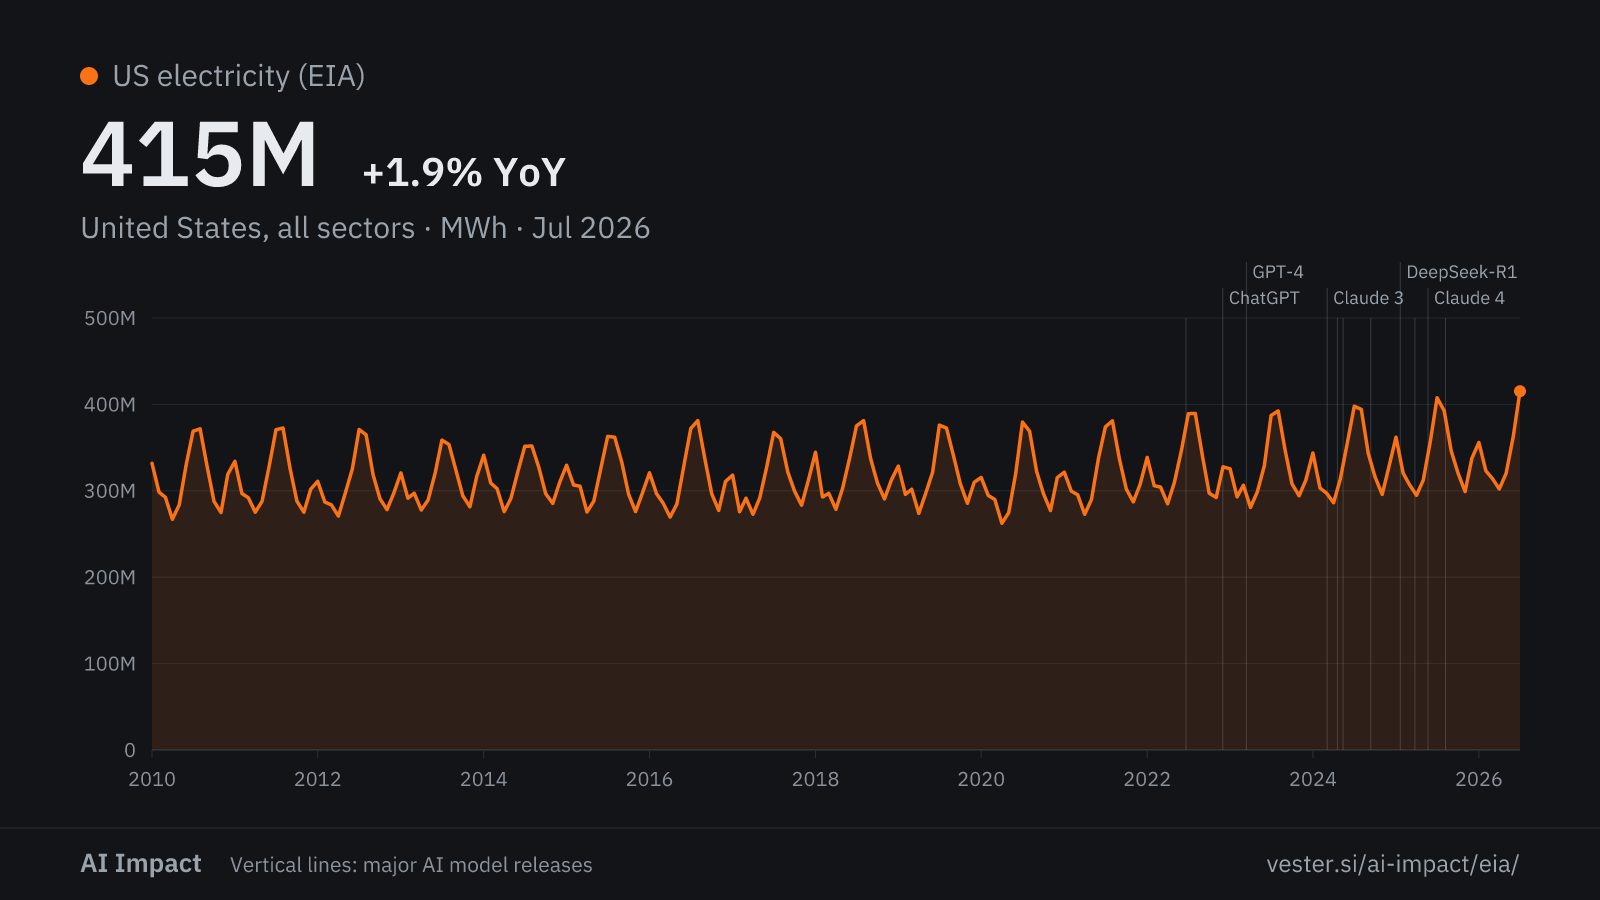
United States, all sectors
415M MWh +1.9% yr as of Jul 2026
Derived
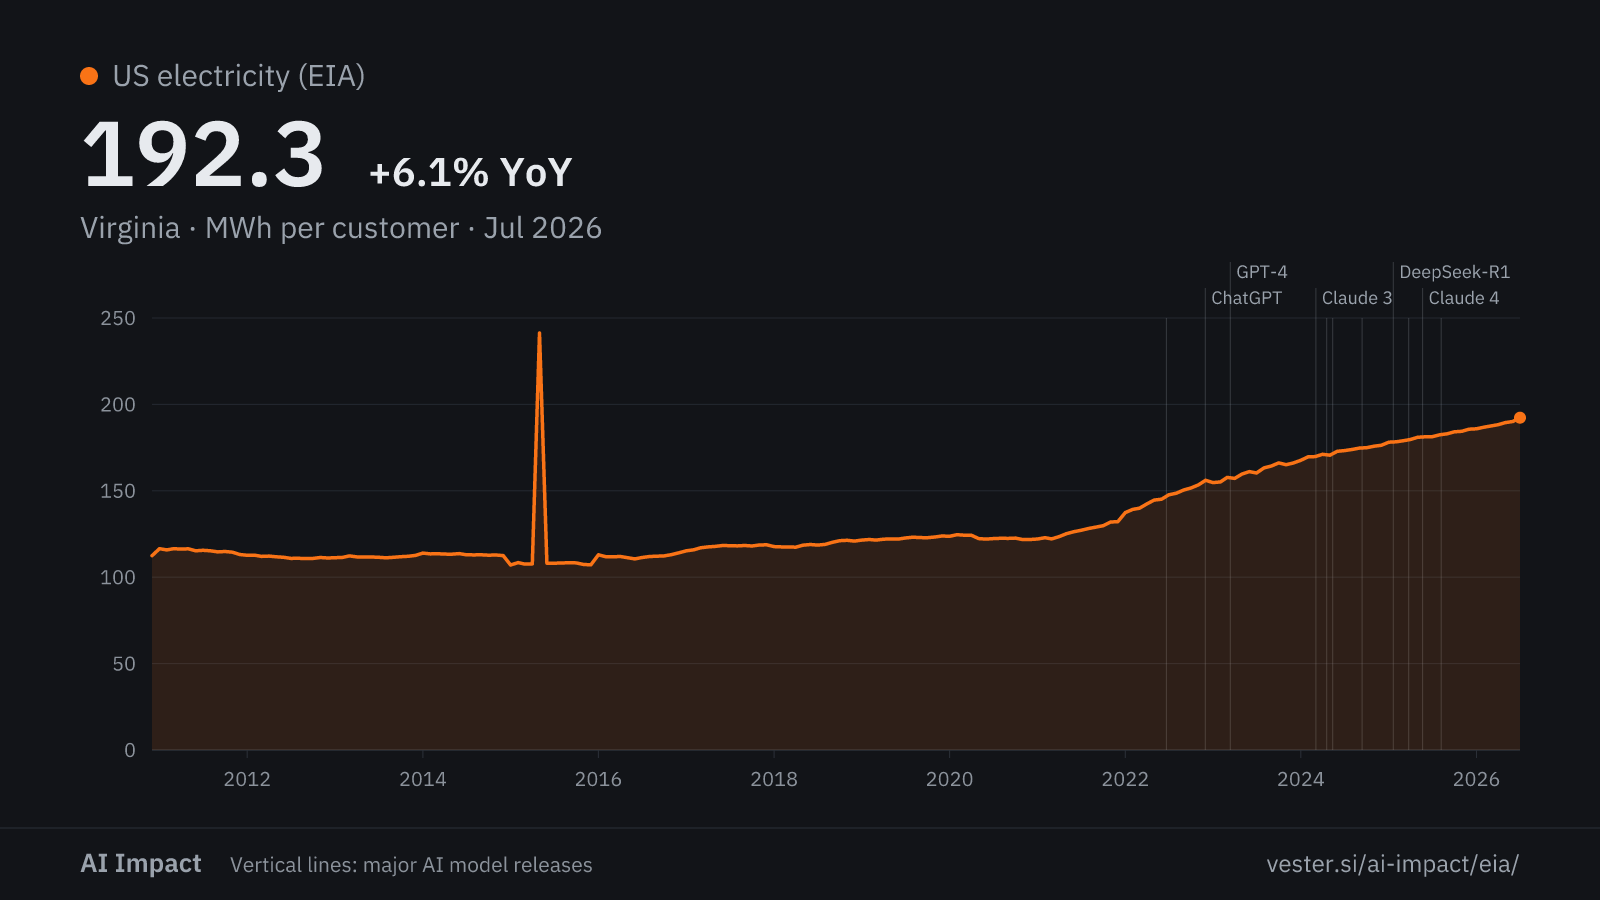
Virginia derived
192.3 MWh per customer +6.1% yr as of Jul 2026
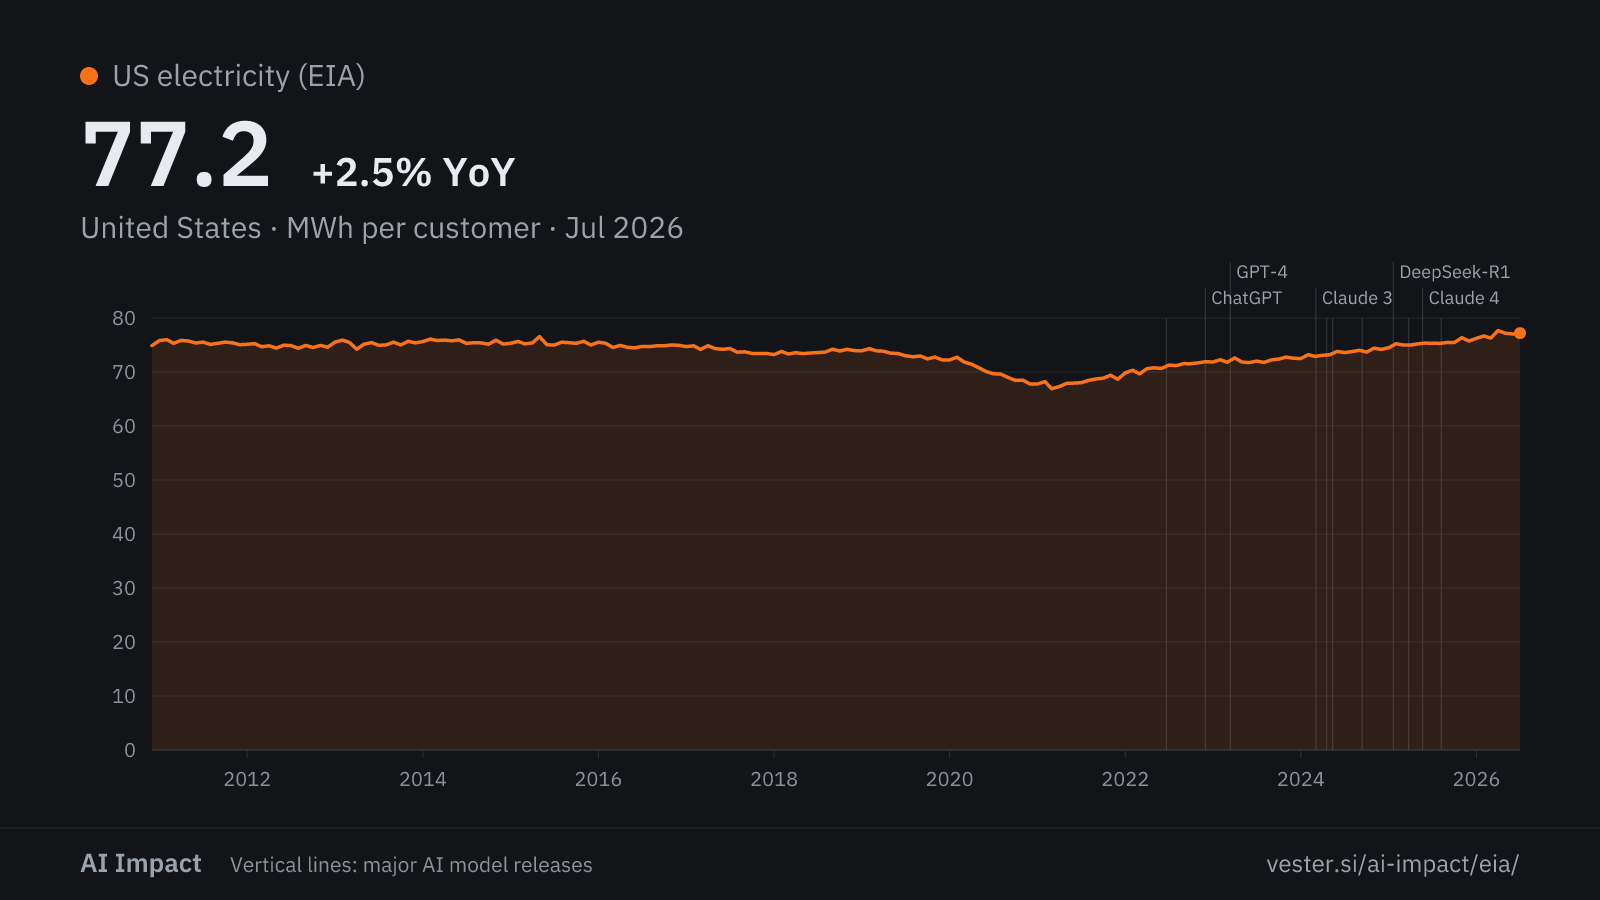
United States derived
77.2 MWh per customer +2.5% yr as of Jul 2026
Figures
| Series | Latest | Change | Min | Max | Coverage |
|---|---|---|---|---|---|
| VirginiaMWh | 8.6M | +13.6% yr | 3.4M | 8.6M | Jan 2010 — Jul 2026 |
| OhioMWh | 6.3M | +12.7% yr | 3.0M | 6.3M | Jan 2010 — Jul 2026 |
| GeorgiaMWh | 6.0M | +5.6% yr | 3.0M | 6.0M | Jan 2010 — Jul 2026 |
| ArizonaMWh | 4.5M | +15.3% yr | 1.9M | 4.5M | Jan 2010 — Jul 2026 |
| New York (control)MWh | 7.0M | −0.1% yr | 4.8M | 7.6M | Jan 2010 — Jul 2026 |
| California (control)MWh | 10.8M | +5.8% yr | 6.5M | 12.4M | Jan 2010 — Jul 2026 |
| United StatesMWh | 151M | +4.3% yr | 91.4M | 151M | Jan 2010 — Jul 2026 |
| Virginia, all sectorsMWh | 14.6M | +5.8% yr | 7.5M | 14.6M | Jan 2010 — Jul 2026 |
| Ohio, all sectorsMWh | 16.8M | +3.8% yr | 9.9M | 16.8M | Jan 2010 — Jul 2026 |
| Georgia, all sectorsMWh | 16.2M | +1.8% yr | 8.9M | 16.2M | Jan 2010 — Jul 2026 |
| Arizona, all sectorsMWh | 11.4M | +9.0% yr | 4.7M | 11.4M | Jan 2010 — Jul 2026 |
| United States, all sectorsMWh | 415M | +1.9% yr | 262M | 415M | Jan 2010 — Jul 2026 |
| Virginia's share of US commercial sales | 5.7% | +3.5% yr | 3.5% | 5.7% | Dec 2010 — Jul 2026 |
| VirginiaMWh per customer | 192.3 | +6.1% yr | 107.1 | 241.3 | Dec 2010 — Jul 2026 |
| United StatesMWh per customer | 77.2 | +2.5% yr | 66.9 | 77.7 | Dec 2010 — Jul 2026 |