US construction (Census)
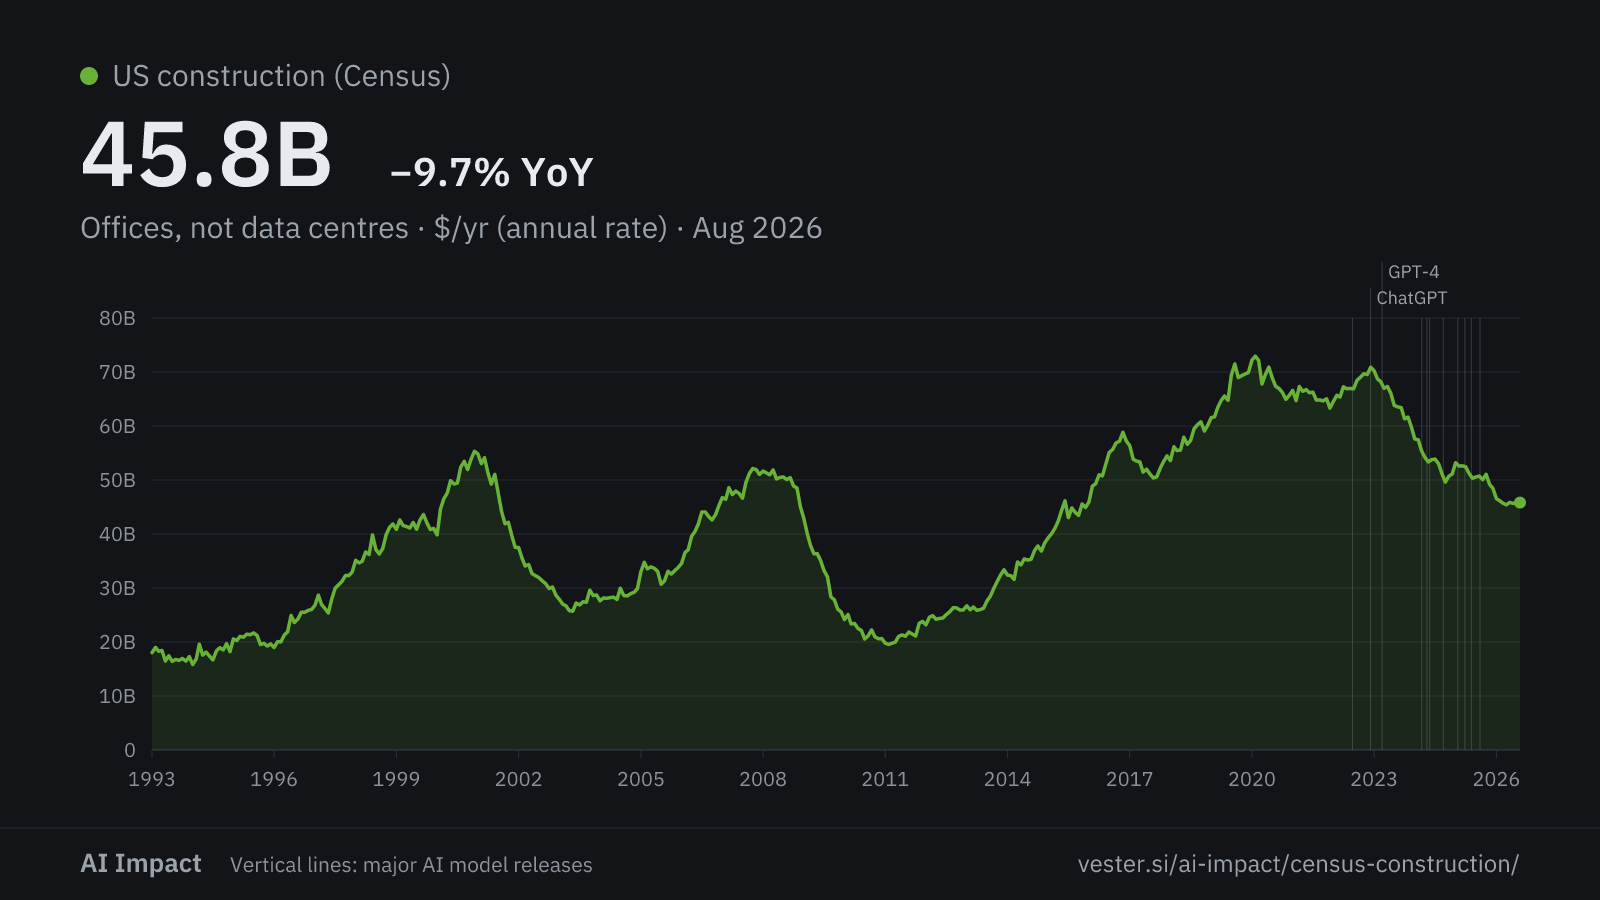
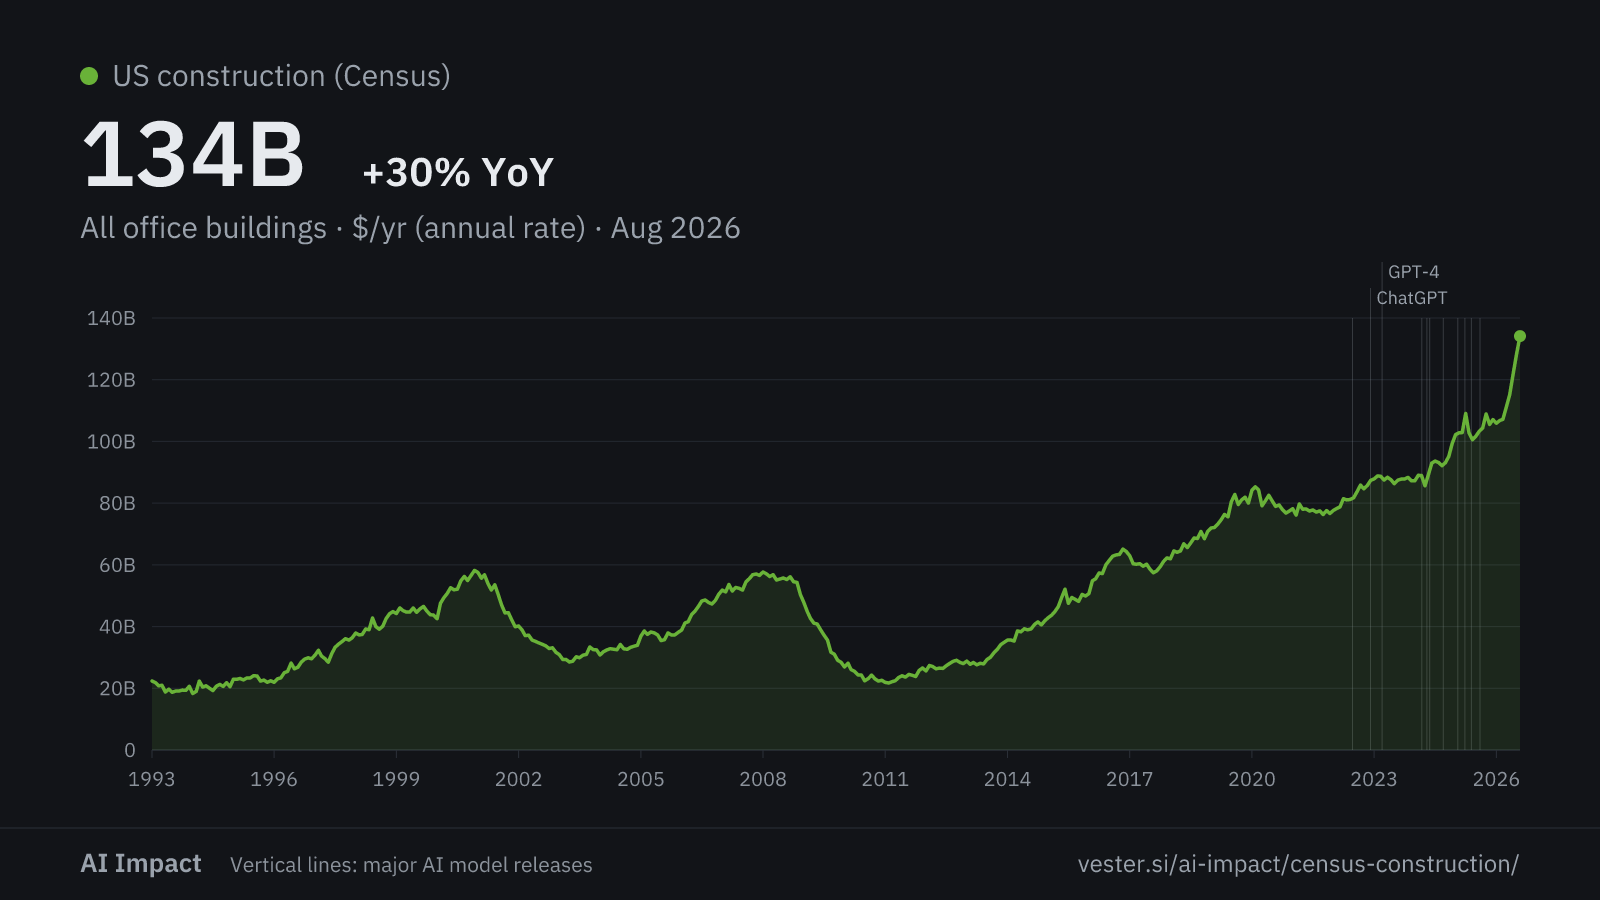
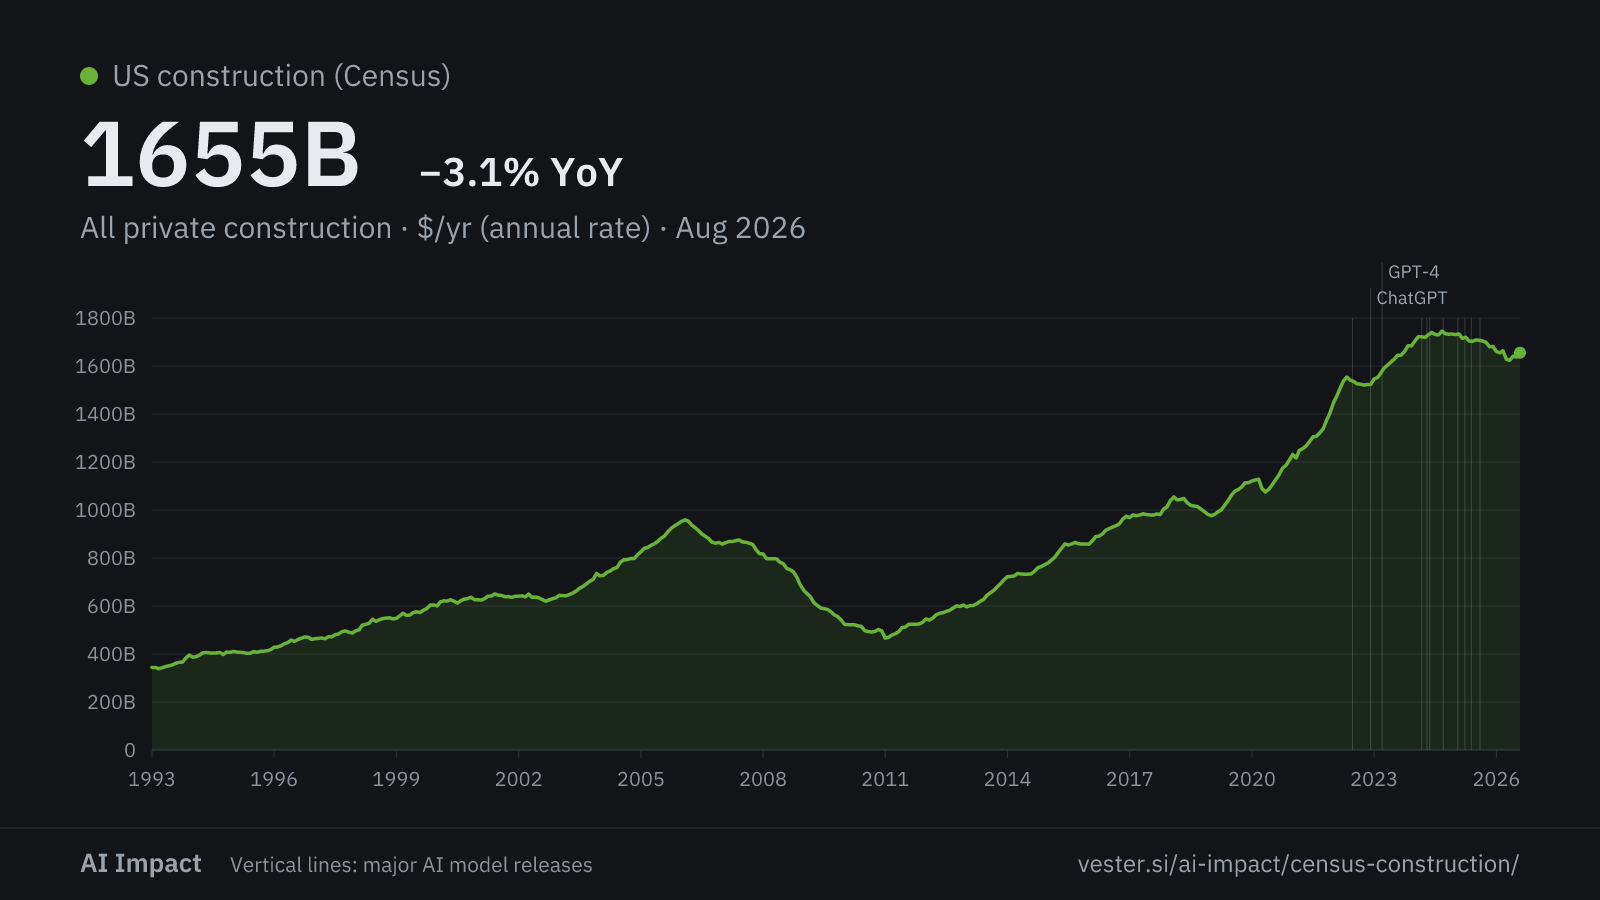
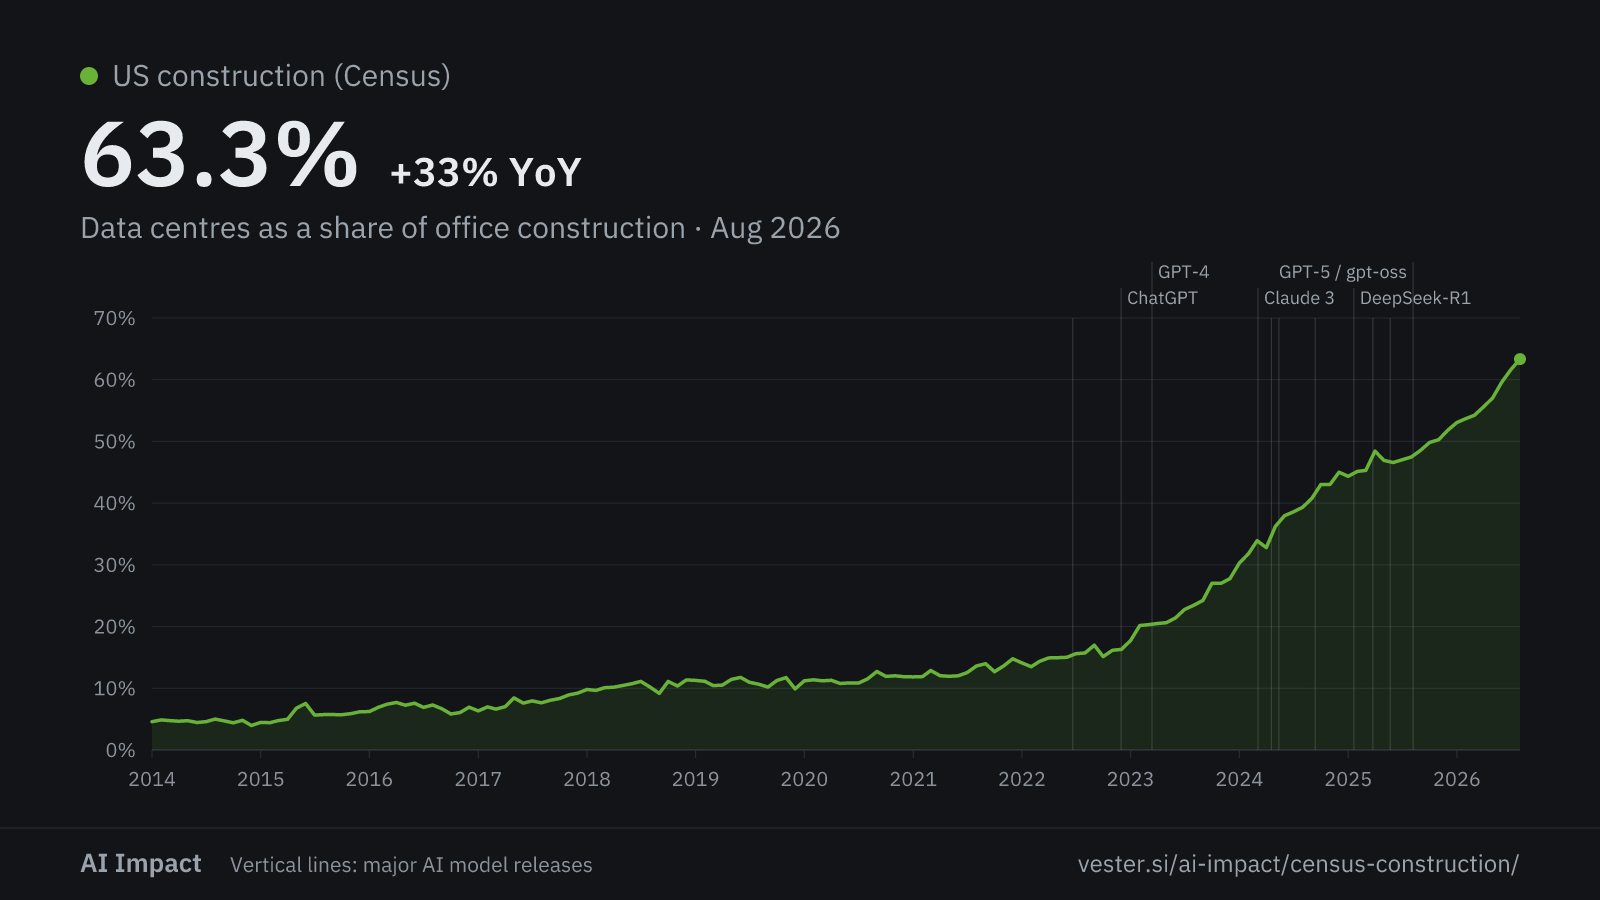
The monthly value of private construction put in place in the United States, from the Census Bureau's C30 survey: data centres, offices other than data centres, all office buildings and all private construction, each as a seasonally adjusted annual rate, plus data centres as a share of office construction. The office series start in 1993 and the data centre category in January 2014.
The Census counts buildings, power and cooling, not the computers inside. Each dollar chart shows a yearly rate, not the money spent in one month.
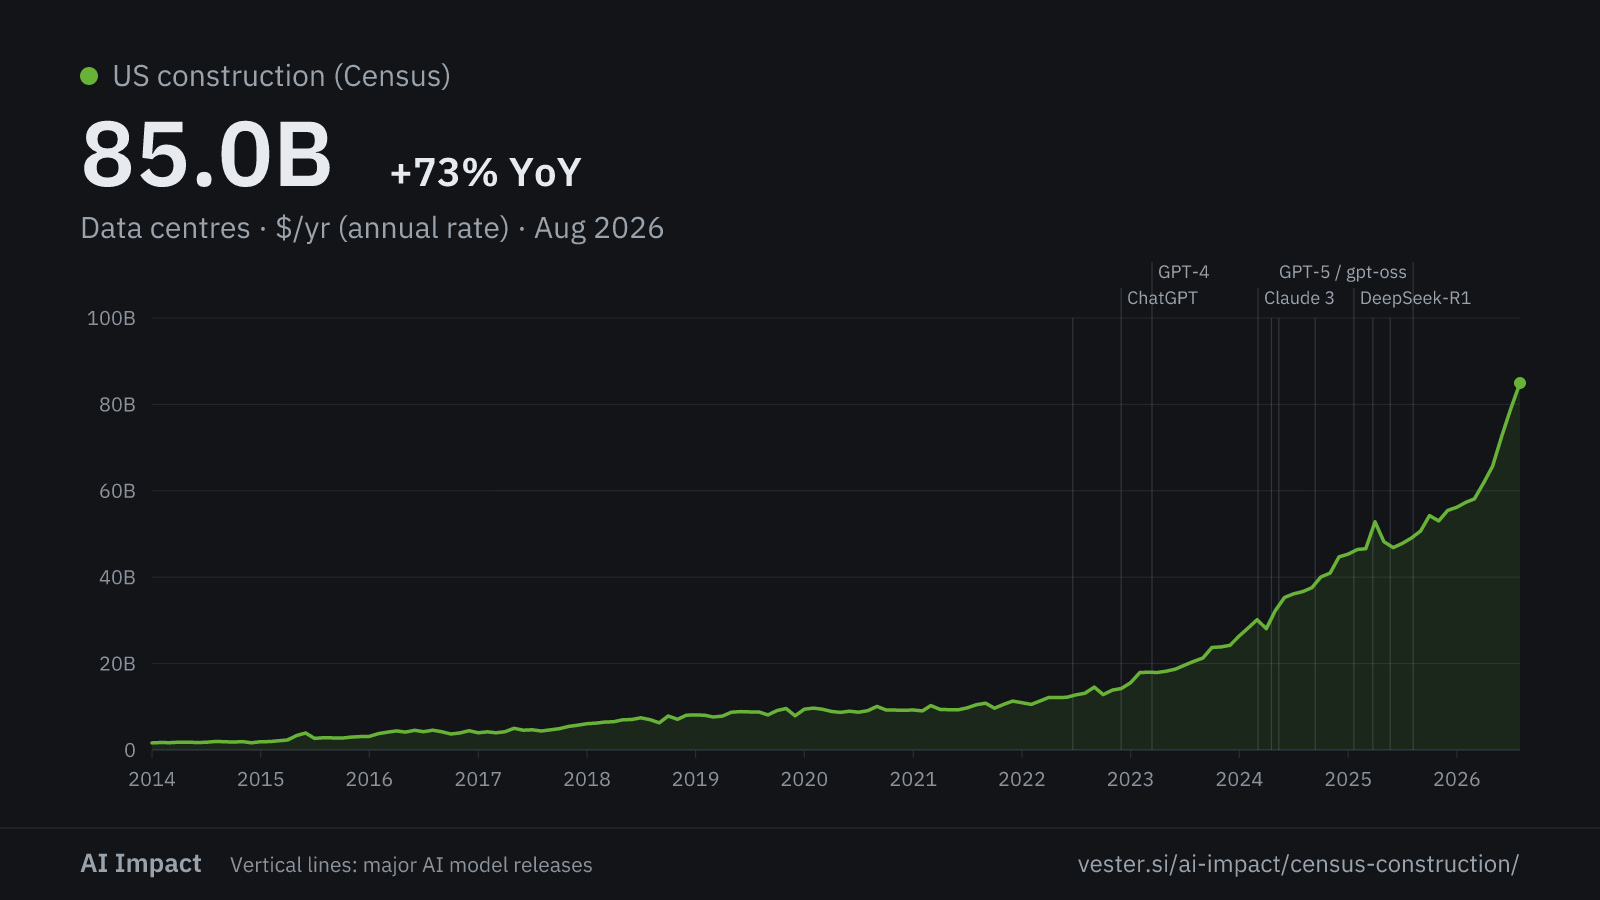
Office buildings and data centres
Offices, not data centres
45.8B $/yr (annual rate) −9.7% yr as of Aug 2026
All office buildings
134B $/yr (annual rate) +29.8% yr as of Aug 2026
All private construction
Derived
Figures
| Series | Latest | Change | Min | Max | Coverage |
|---|---|---|---|---|---|
| Data centres$/yr (annual rate) | 85.0B | +73.2% yr | 1.6B | 85.0B | Jan 2014 — Aug 2026 |
| Offices, not data centres$/yr (annual rate) | 45.8B | −9.7% yr | 15.8B | 72.9B | Jan 1993 — Aug 2026 |
| All office buildings$/yr (annual rate) | 134B | +29.8% yr | 18.3B | 134B | Jan 1993 — Aug 2026 |
| All private construction$/yr (annual rate) | 1655B | −3.1% yr | 339B | 1745B | Jan 1993 — Aug 2026 |
| Data centres as a share of office construction | 63.3% | +33.4% yr | 4.0% | 63.3% | Jan 2014 — Aug 2026 |