Nvidia revenue (SEC)
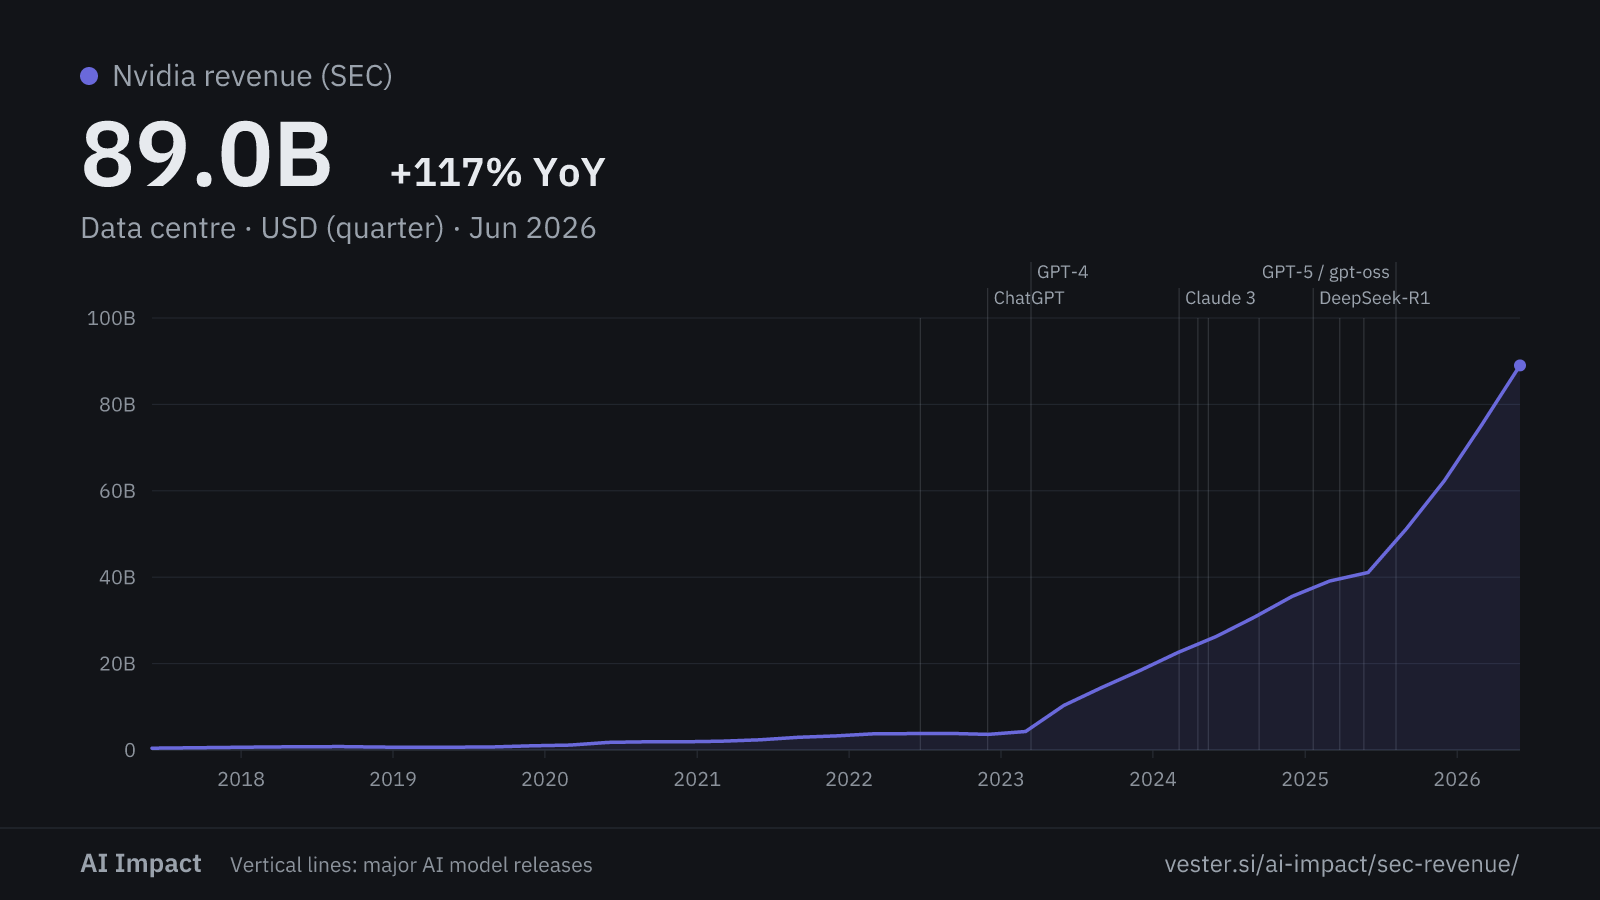
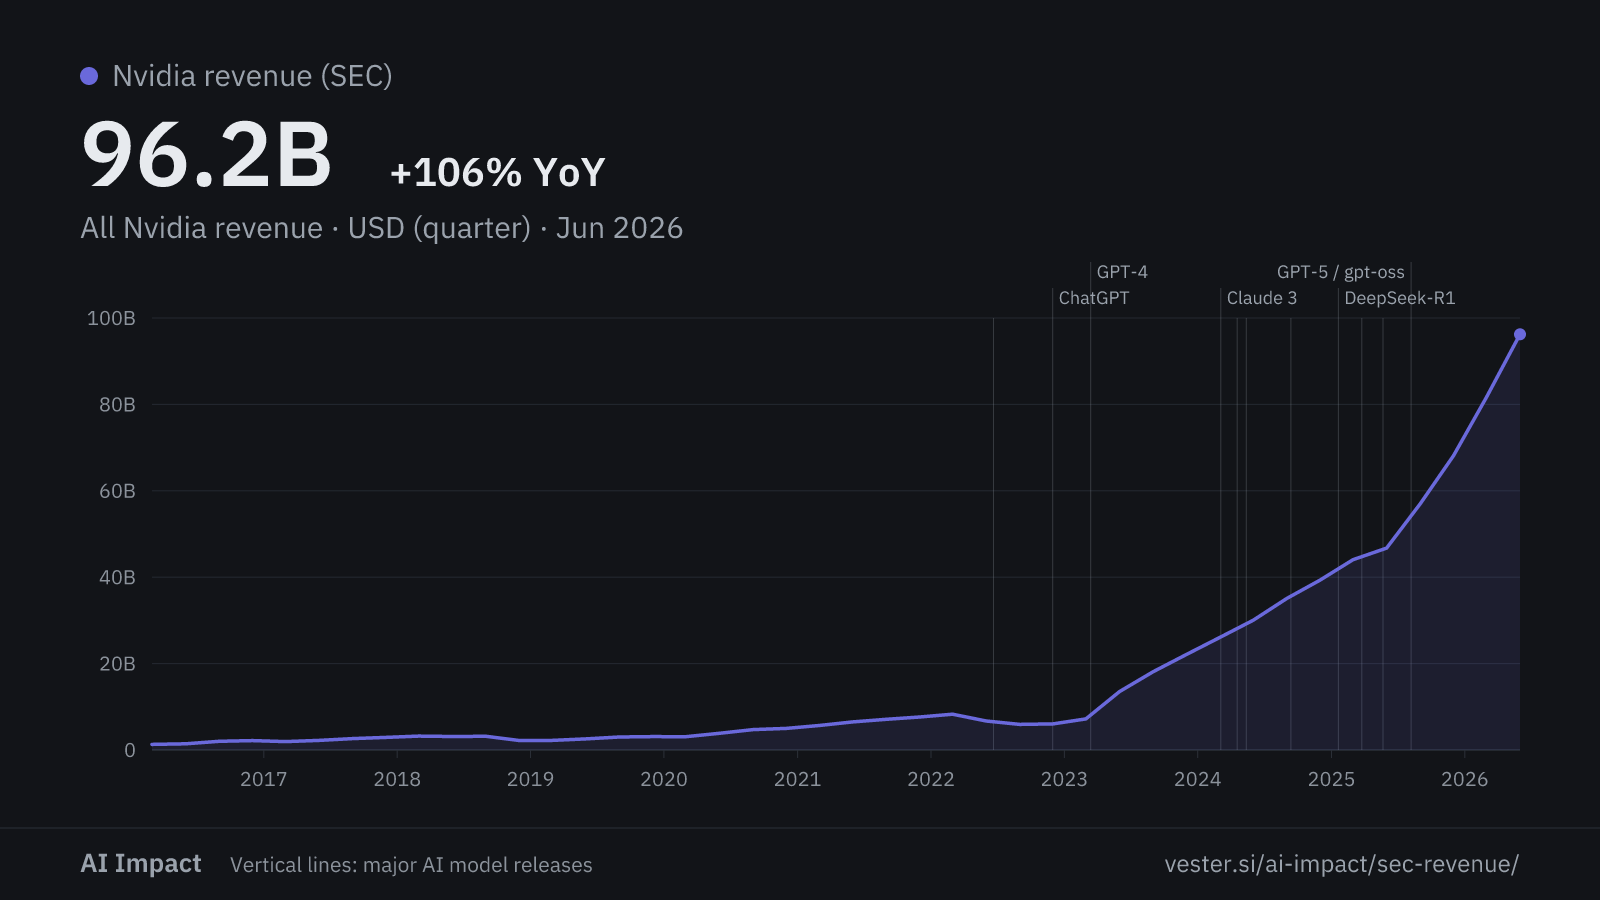
What Nvidia sells, by market platform, taken from the XBRL inside its own quarterly and annual filings with the SEC since 2016. Data-centre revenue is the cleanest single number for AI hardware demand there is — $0.42bn in the quarter to July 2017, $3.62bn in the quarter ChatGPT shipped, $75.25bn in the quarter to April 2026 — and it is here beside the gaming, visualization and automotive lines it left behind, and beside the whole company's revenue.
Nvidia ends its quarters one month before the calendar quarters. We place each quarter in the calendar quarter that holds most of it.
Derived
Baseline
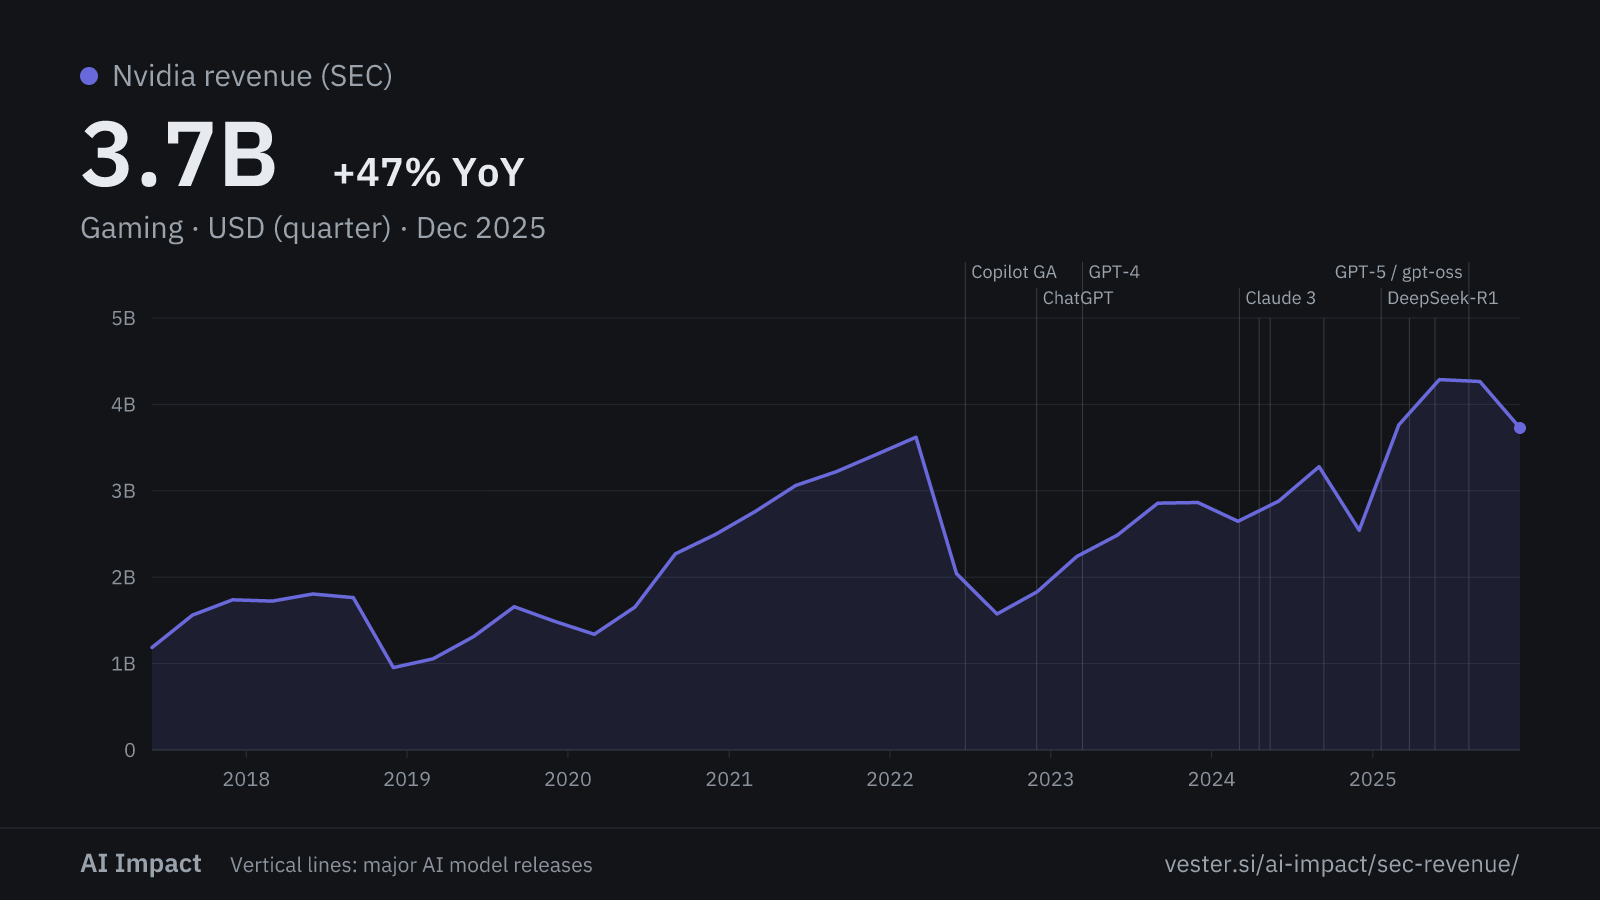
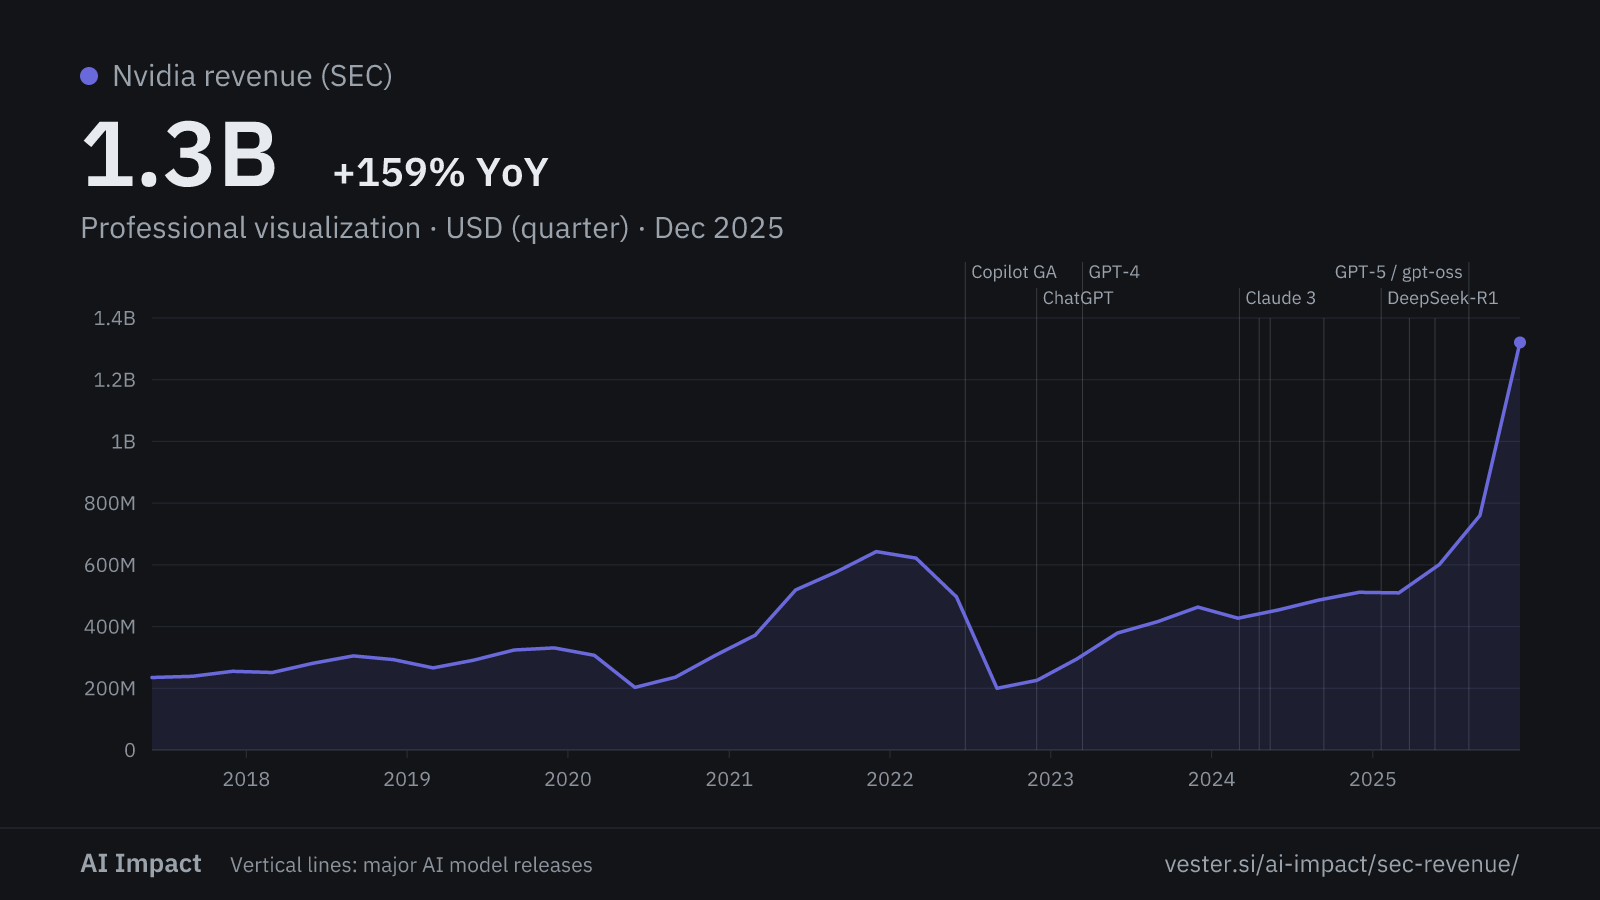
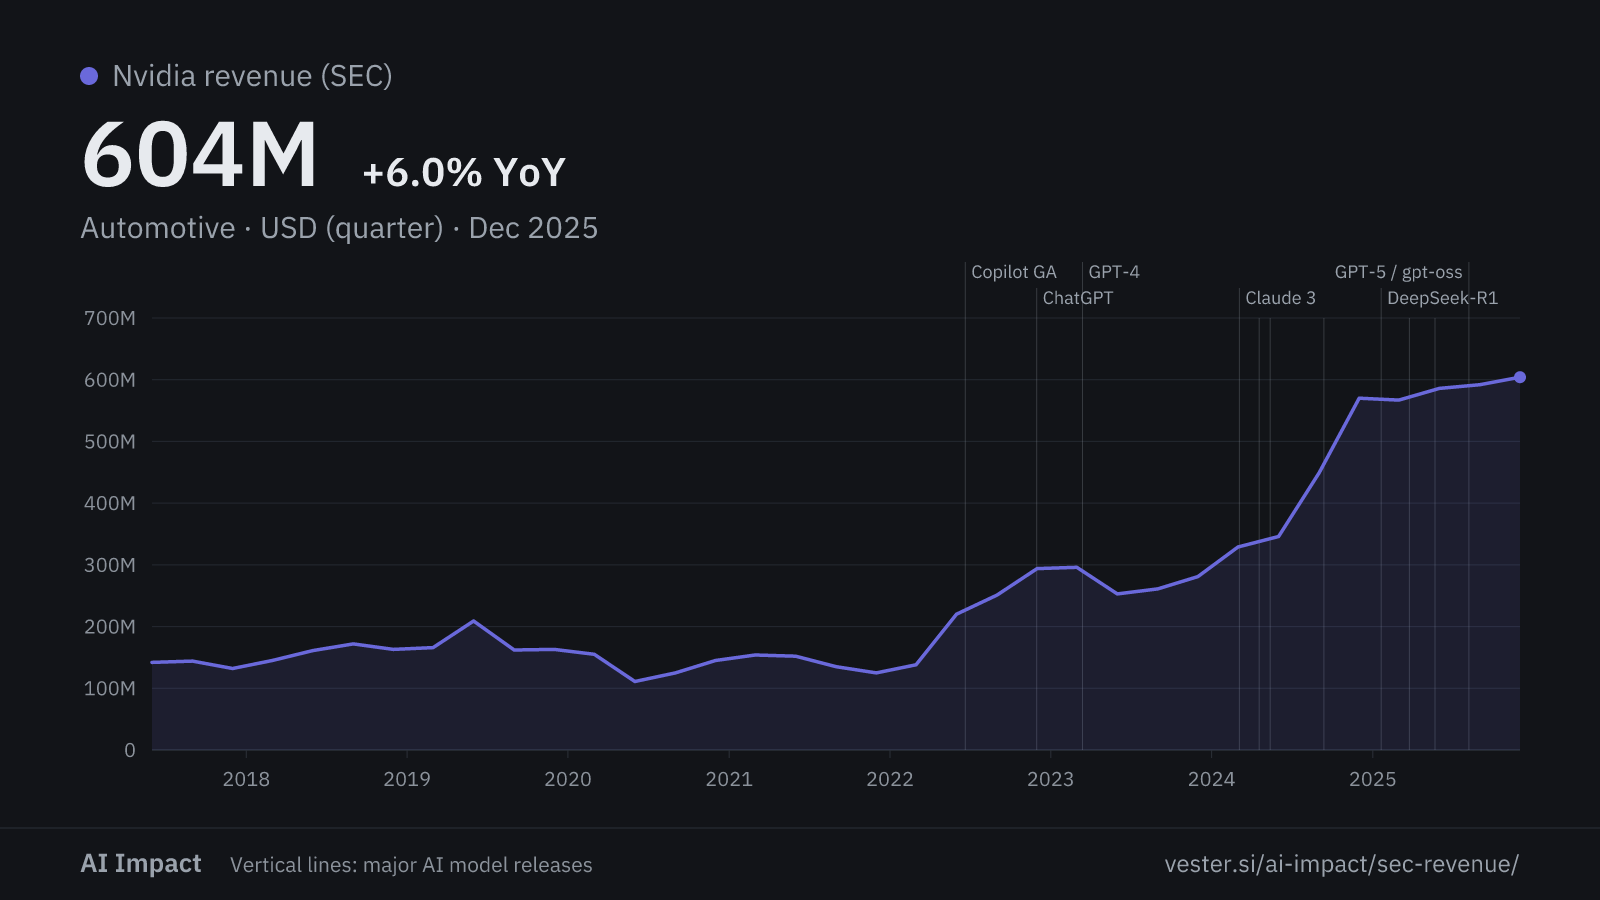
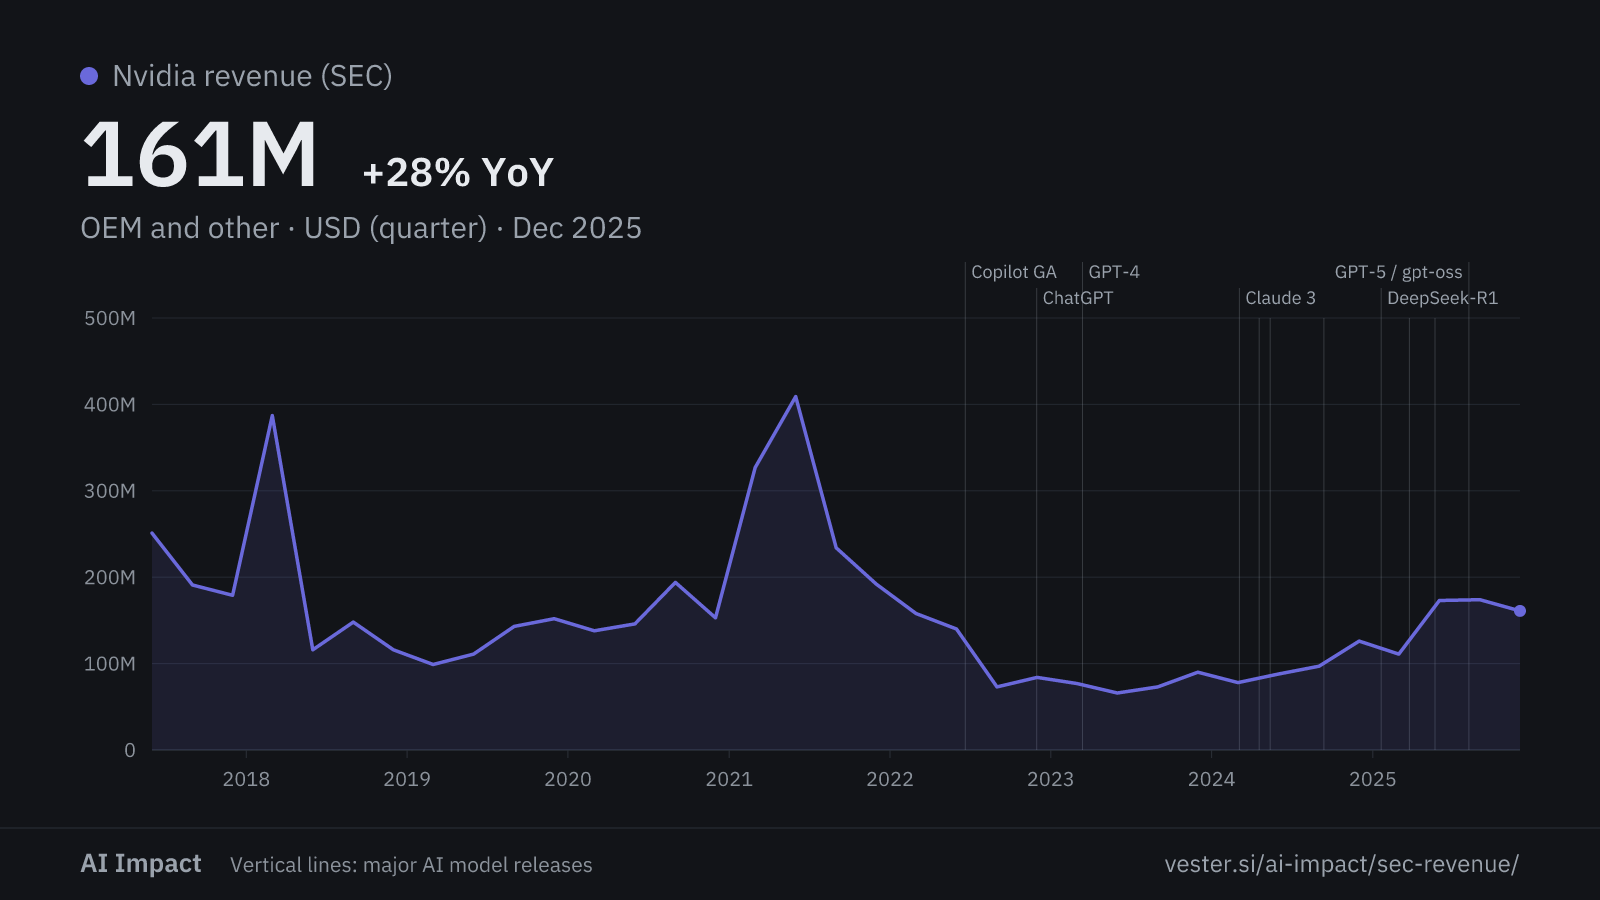
The other market platforms
Nvidia last reported these four charts for the quarter that ended in January 2026.
Inside the data-centre line
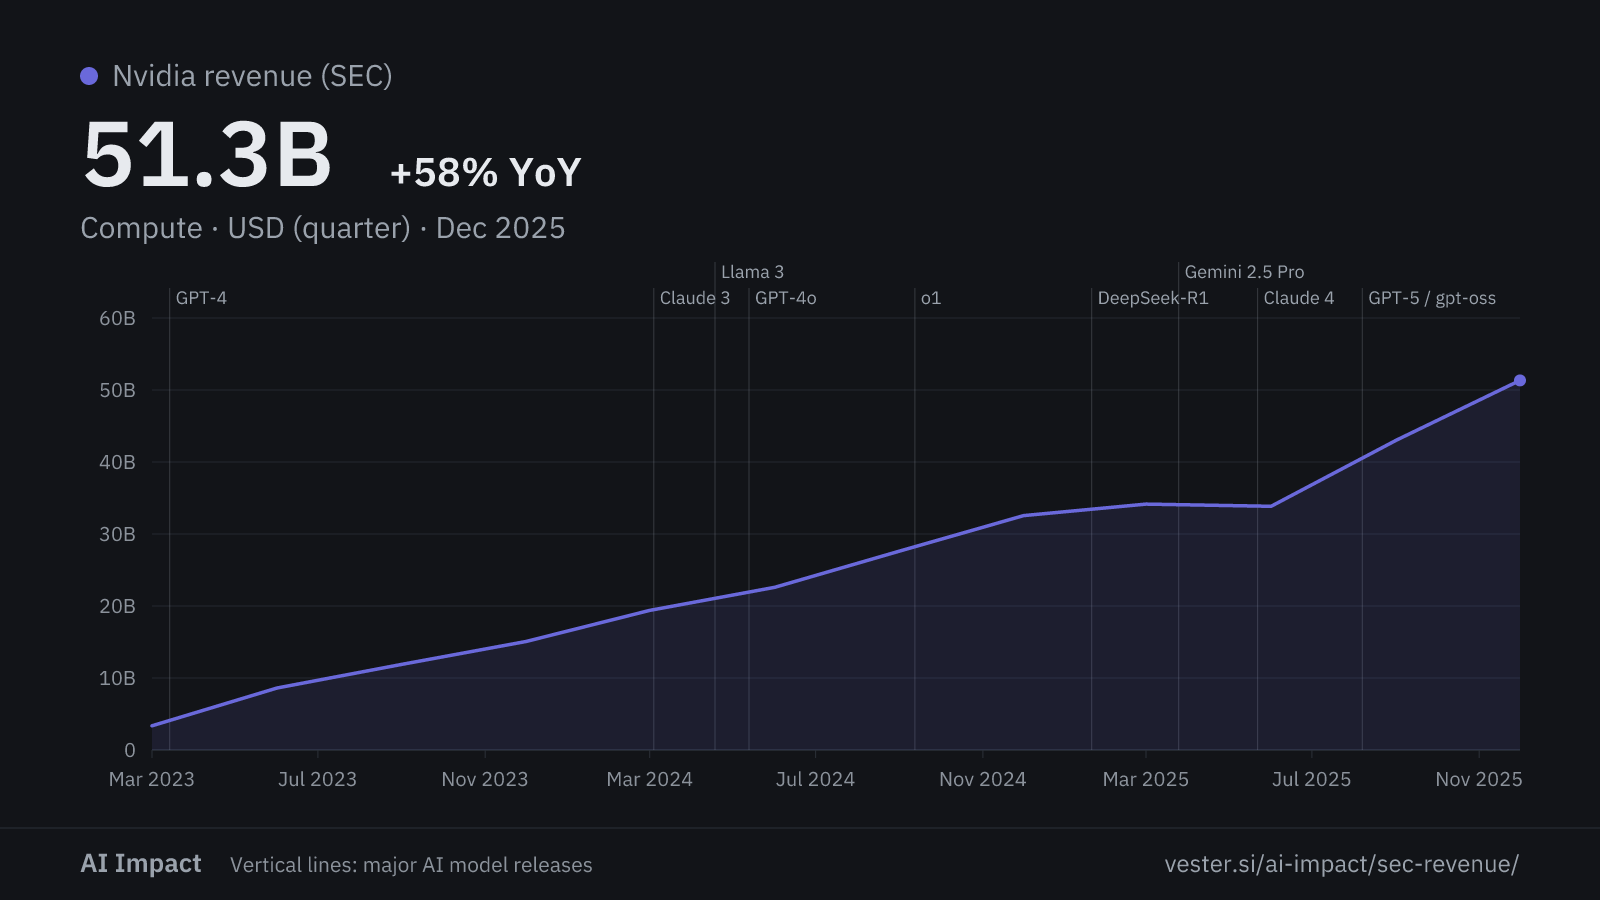
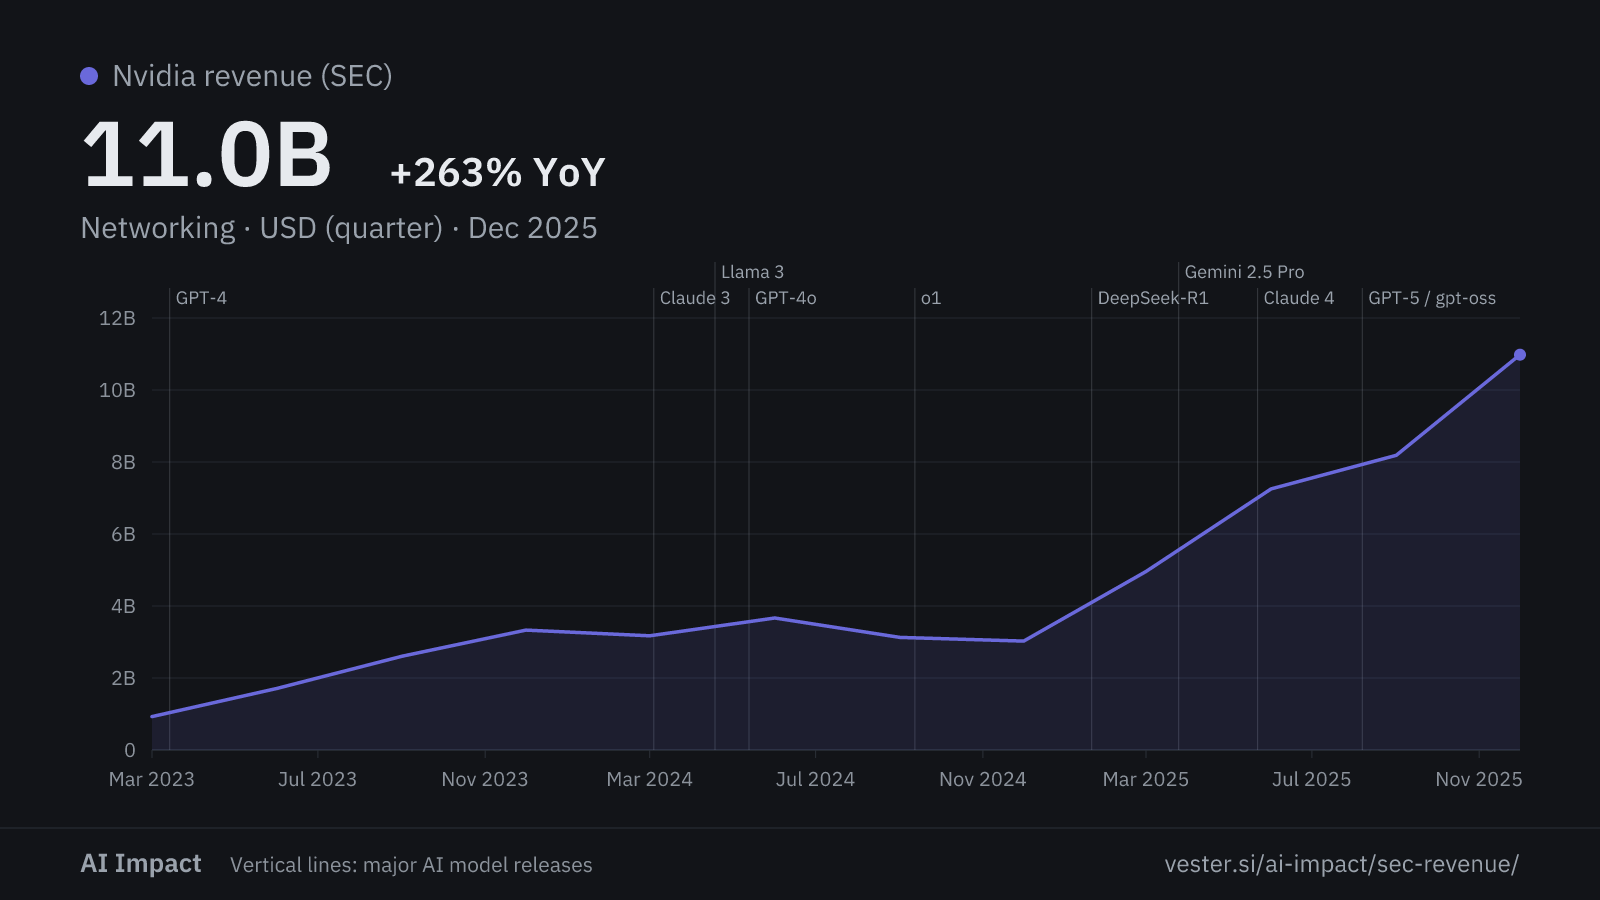
These two charts add up to the data-centre line. Nvidia last reported them for the quarter that ended in January 2026.
Figures
| Series | Latest | Change | Min | Max | Coverage |
|---|---|---|---|---|---|
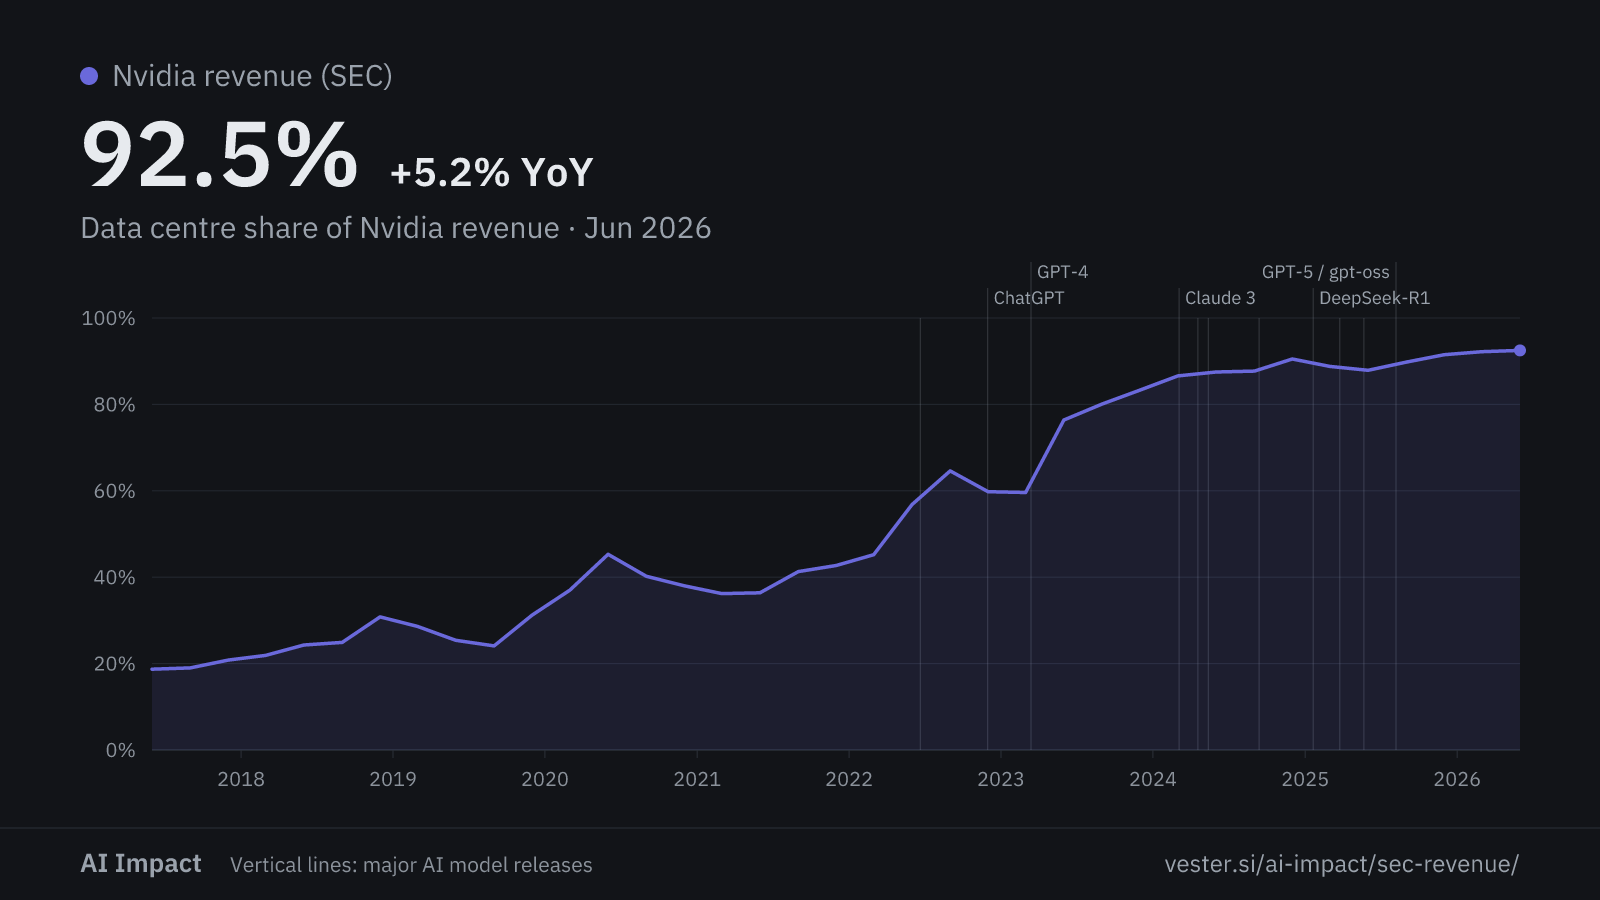
| Data centre share of Nvidia revenue | 92.5% | +5.2% yr | 18.7% | 92.5% | Jun 2017 — Jun 2026 |
| Data centreUSD (quarter) | 89.0B | +116.6% yr | 416M | 89.0B | Jun 2017 — Jun 2026 |
| All Nvidia revenueUSD (quarter) | 96.2B | +105.9% yr | 1.3B | 96.2B | Mar 2016 — Jun 2026 |
| GamingUSD (quarter) | 3.7B | +46.5% yr | 954M | 4.3B | Jun 2017 — Dec 2025 |
| Professional visualizationUSD (quarter) | 1.3B | +158.5% yr | 200M | 1.3B | Jun 2017 — Dec 2025 |
| AutomotiveUSD (quarter) | 604M | +6.0% yr | 111M | 604M | Jun 2017 — Dec 2025 |
| OEM and otherUSD (quarter) | 161M | +27.8% yr | 66.0M | 409M | Jun 2017 — Dec 2025 |
| ComputeUSD (quarter) | 51.3B | +57.7% yr | 3.4B | 51.3B | Mar 2023 — Dec 2025 |
| NetworkingUSD (quarter) | 11.0B | +263.1% yr | 927M | 11.0B | Mar 2023 — Dec 2025 |