y-axis

US imports (Census)

Monthly US imports of computing hardware from the Census Bureau's Foreign Trade Division since 2015: the customs value of processing units (HS 8471.50) from the world and from Taiwan, the number of units, computer parts (HS 8473.30), integrated circuits and all US goods imports as controls, and derived series for the share of all US goods imports and the average value of one unit.

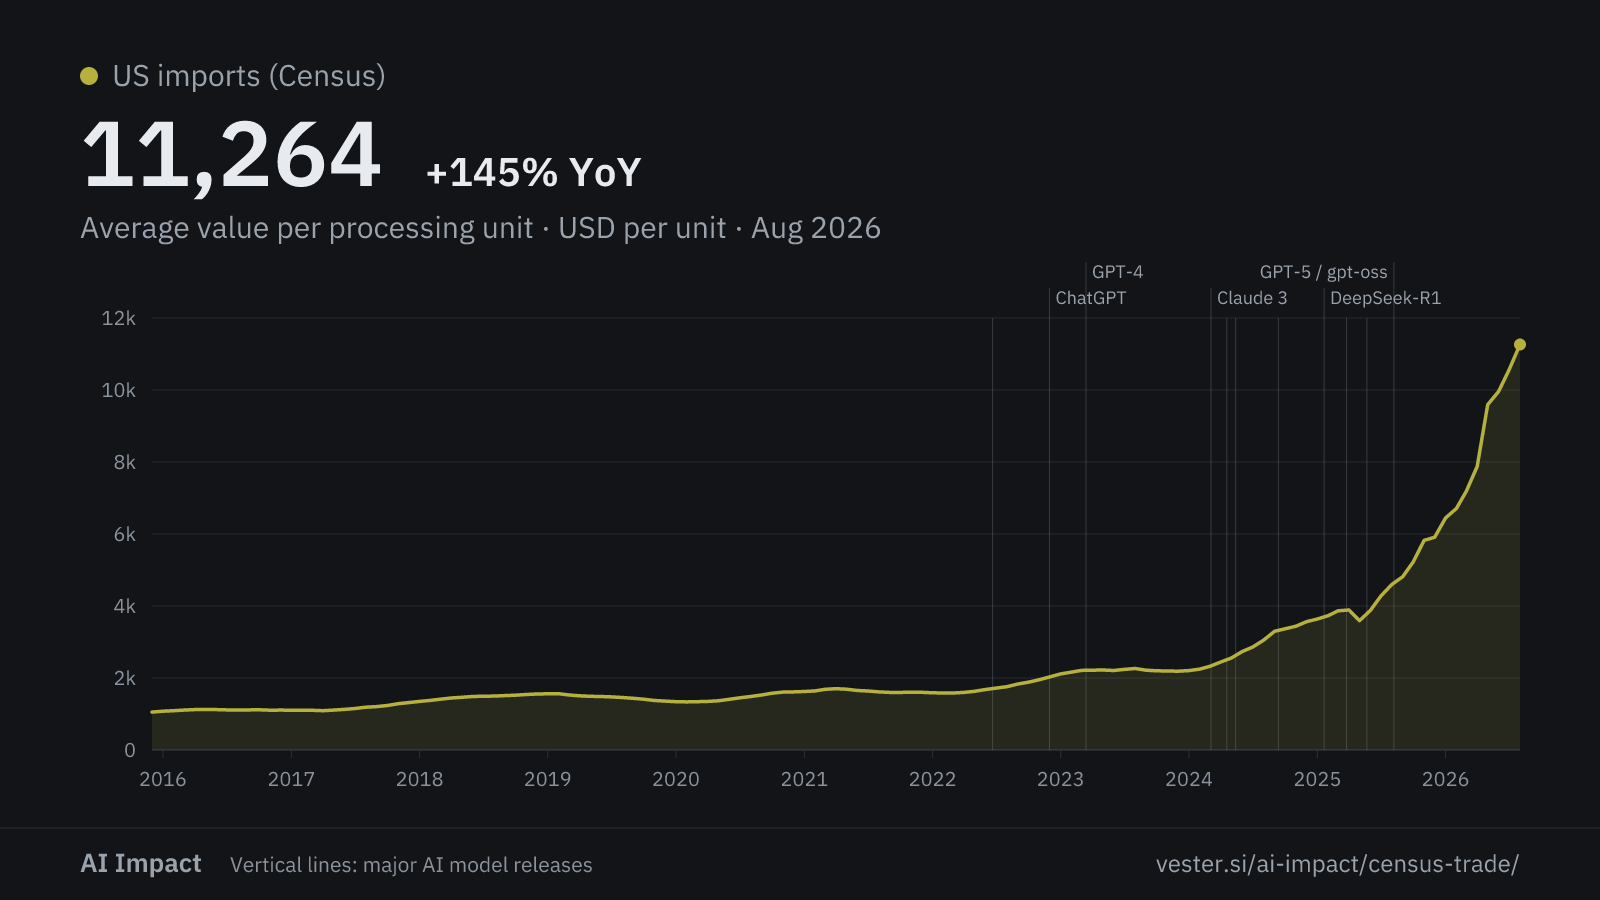
These charts count dollars, not machines. Most of the growth is price: one unit costs far more than it did in 2023. ⚠ The rise starts in 2024, not with ChatGPT.
cadence · monthly 8 series updated 14 Aug 2026 www.census.gov/foreign-trade/data/index.html ↗
release markers

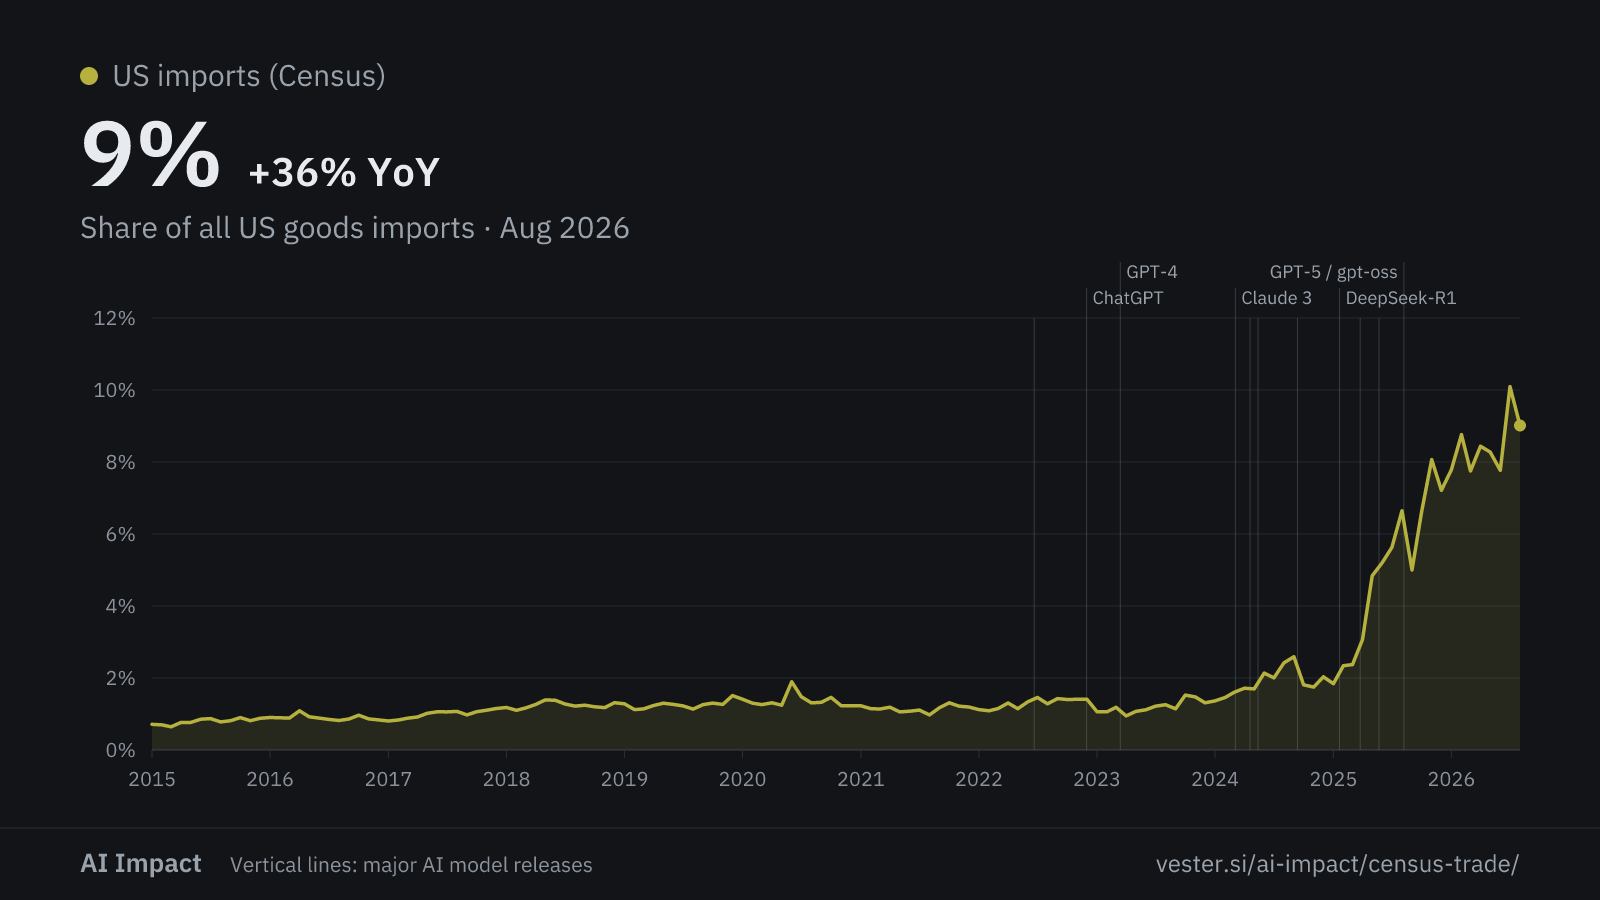
Share of all US goods imports derived

7.8% of US goods imports +49.4% yr as of Jun 2026
02468201520162017201820192020202120222023202420252026Copilot GAClaude 3Gemini 2.5 Pro
The value of imports under HS 8471.50, divided by the value of all US goods imports in the same month.

AI hardware imports

The customs value of goods that entered the United States. These codes cover all servers and computer parts, not only AI hardware.

Processing units (HS 8471.50)
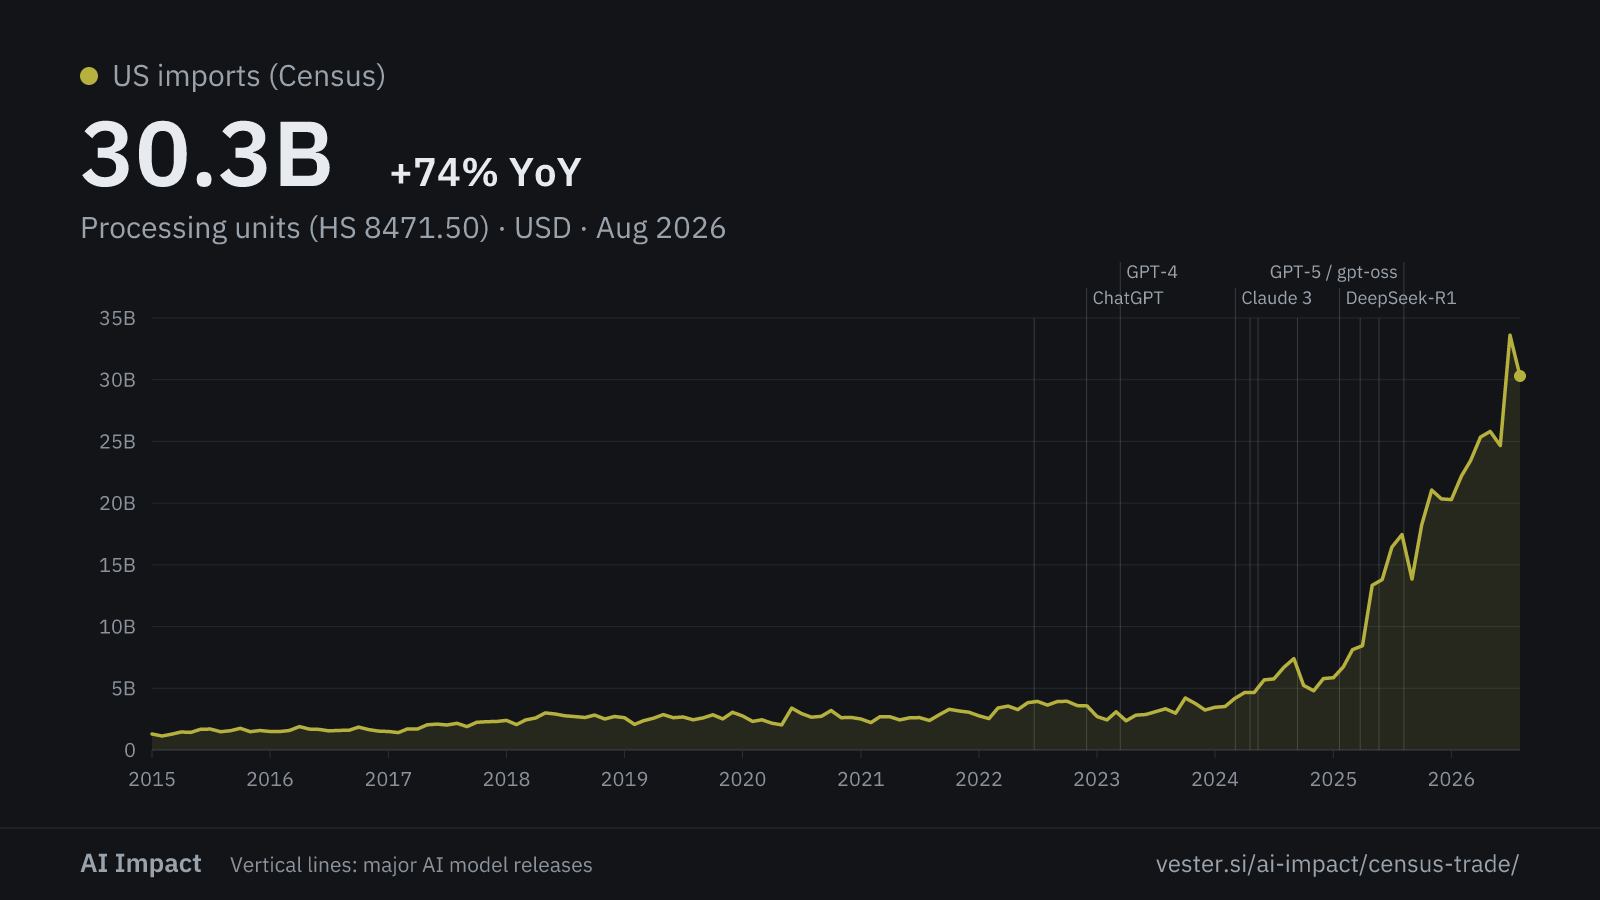
24.7B +78.6% yr as of Jun 2026
05.0B10.0B15.0B20.0B25.0B201520162017201820192020202120222023202420252026Copilot GAClaude 3Gemini 2.5 Pro
The code covers every processing unit that enters the country, from an AI server rack to a desktop computer.

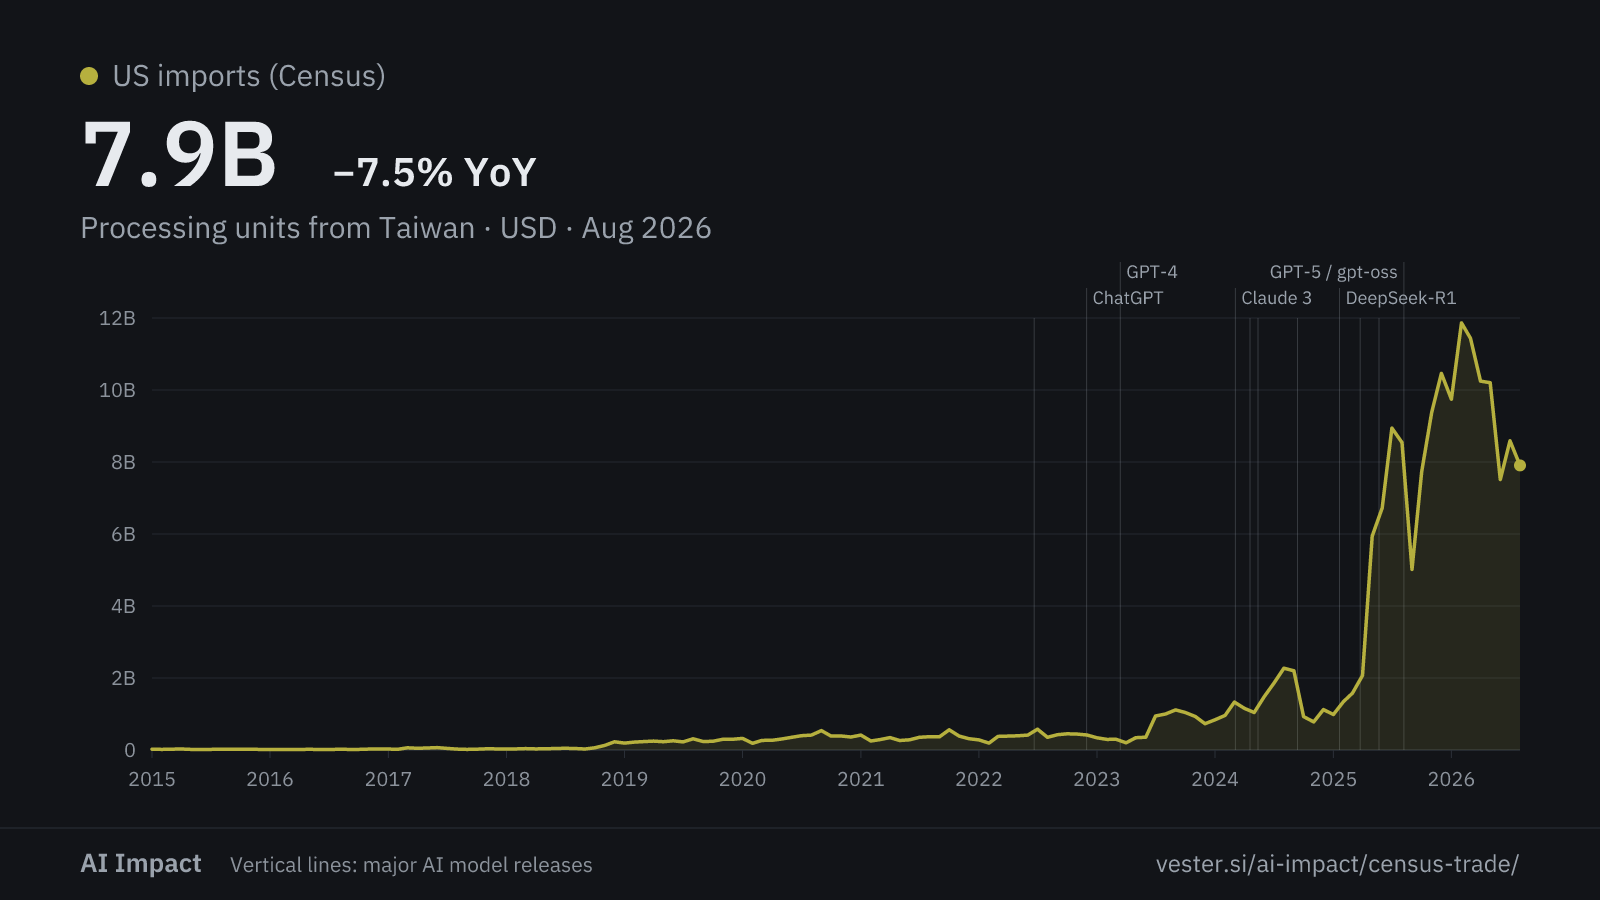
Processing units from Taiwan

7.5B +11.8% yr as of Jun 2026
02.0B4.0B6.0B8.0B10.0B12.0B201520162017201820192020202120222023202420252026Copilot GAClaude 3Gemini 2.5 Pro

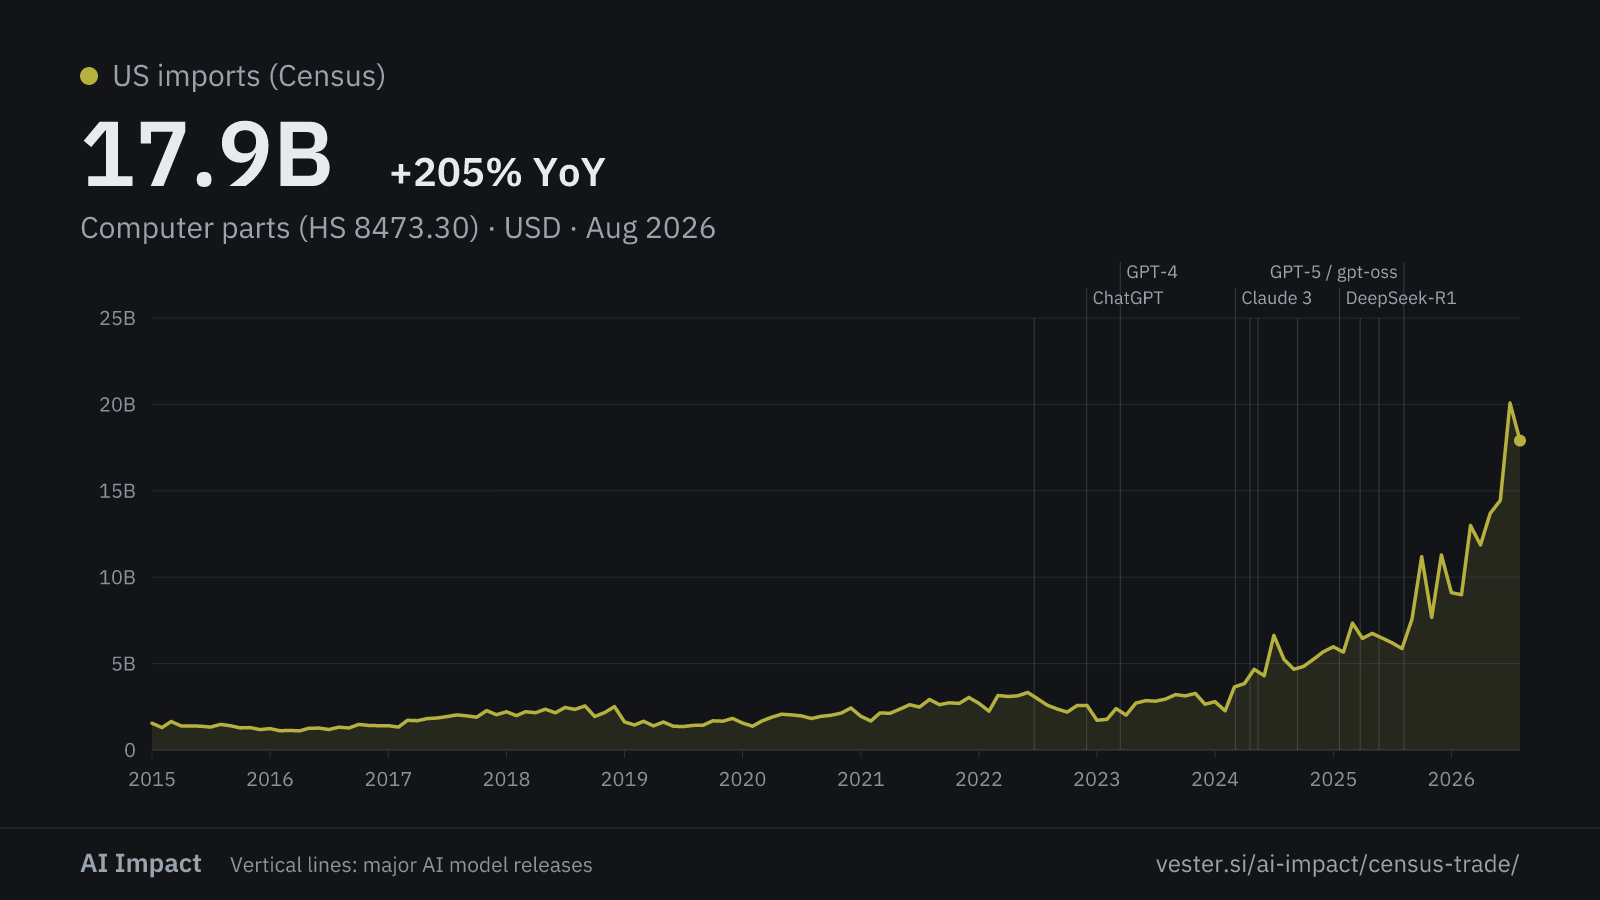
Computer parts (HS 8473.30)

14.4B +123.0% yr as of Jun 2026
02.0B4.0B6.0B8.0B10.0B12.0B14.0B201520162017201820192020202120222023202420252026Copilot GAClaude 3Gemini 2.5 Pro
The code covers all parts of computers. Bare accelerator boards arrive under it, and so does much else.

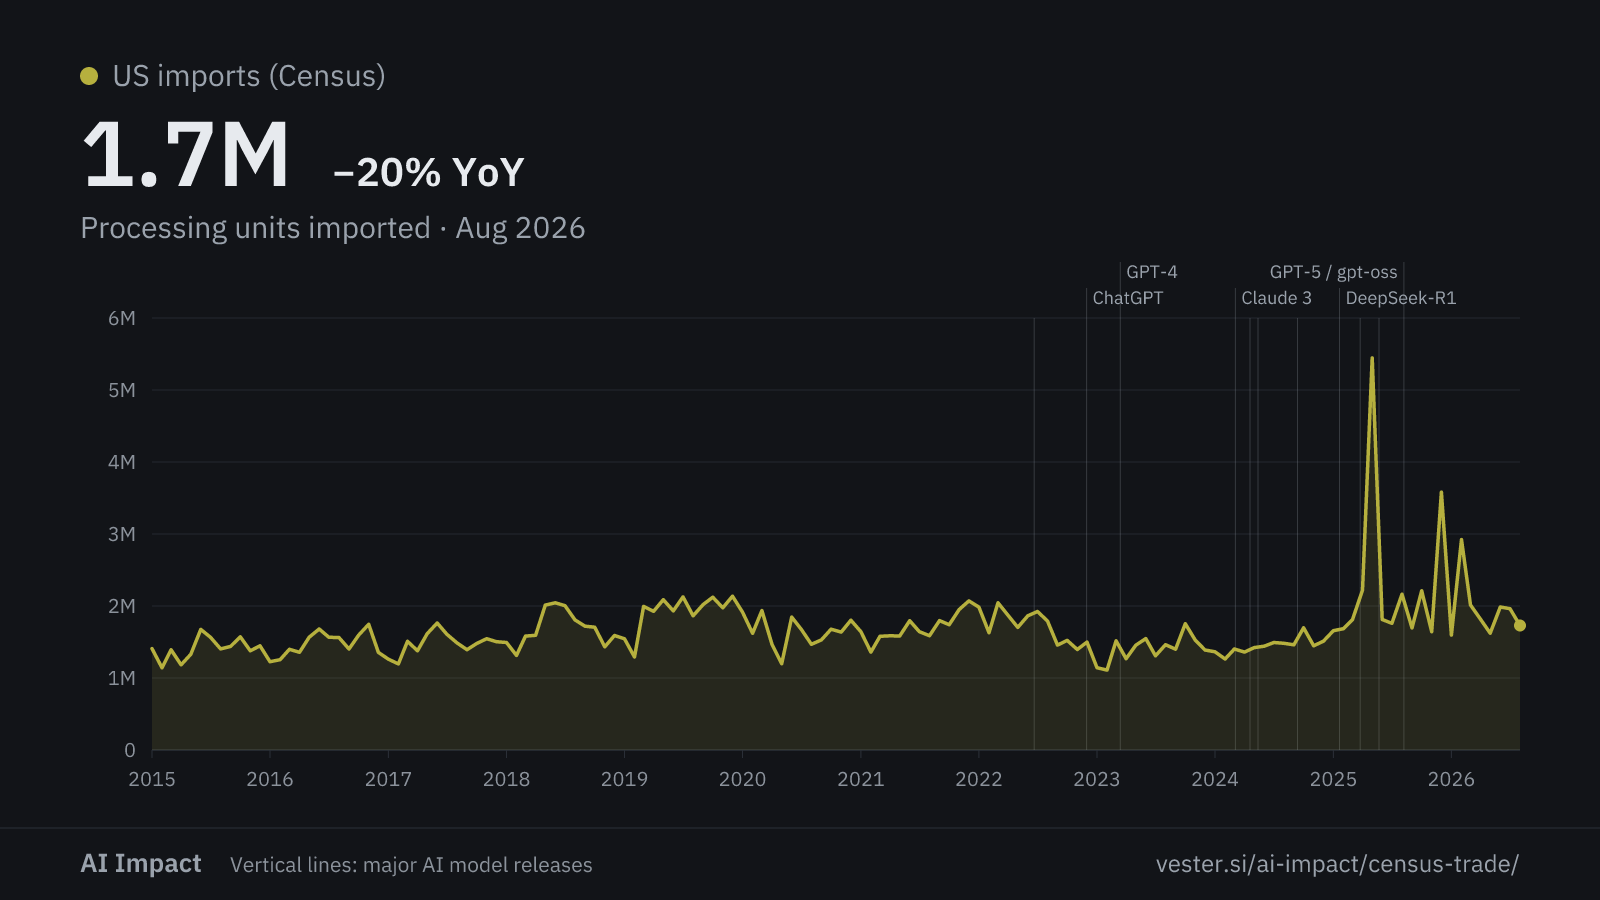
Processing units imported

2.0M +9.6% yr as of Jun 2026
01.0M2.0M3.0M4.0M5.0M201520162017201820192020202120222023202420252026Copilot GAClaude 3Gemini 2.5 Pro
A count of machines, not dollars. It covers the same code as the chart “Processing units (HS 8471.50)”.

Controls

Each chart here is a control. Read them beside the AI hardware charts to see what ordinary import growth looks like.

Integrated circuits (control)
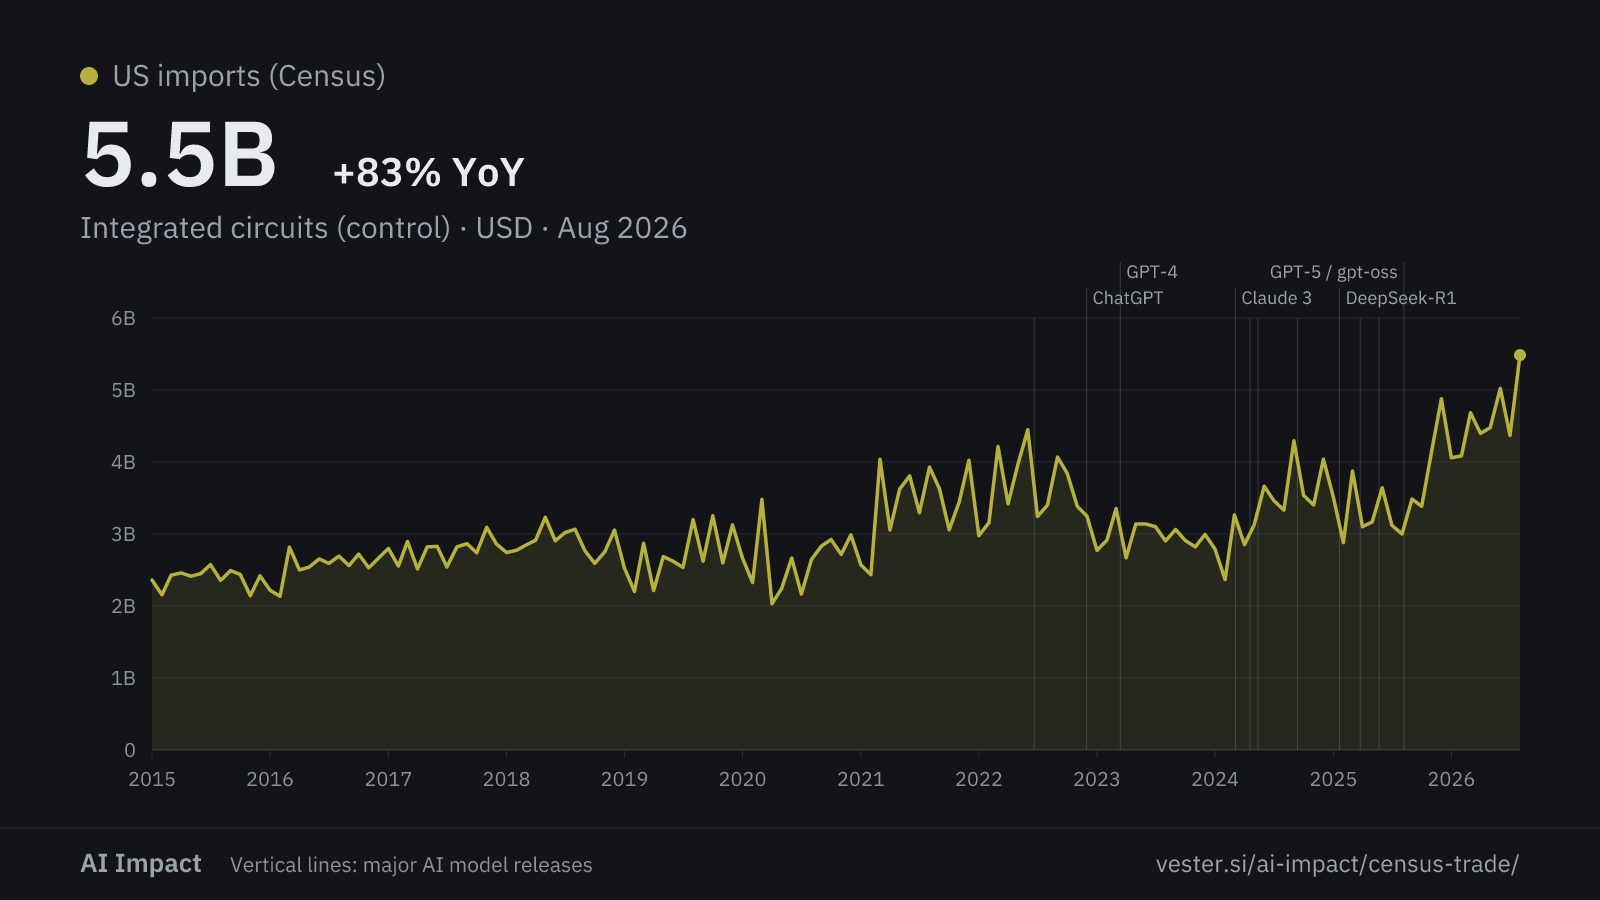
5.0B +37.9% yr as of Jun 2026
01.0B2.0B3.0B4.0B5.0B201520162017201820192020202120222023202420252026Copilot GAClaude 3Gemini 2.5 Pro
This chart is a control. Chip imports track phones and cars, not the AI build-out.

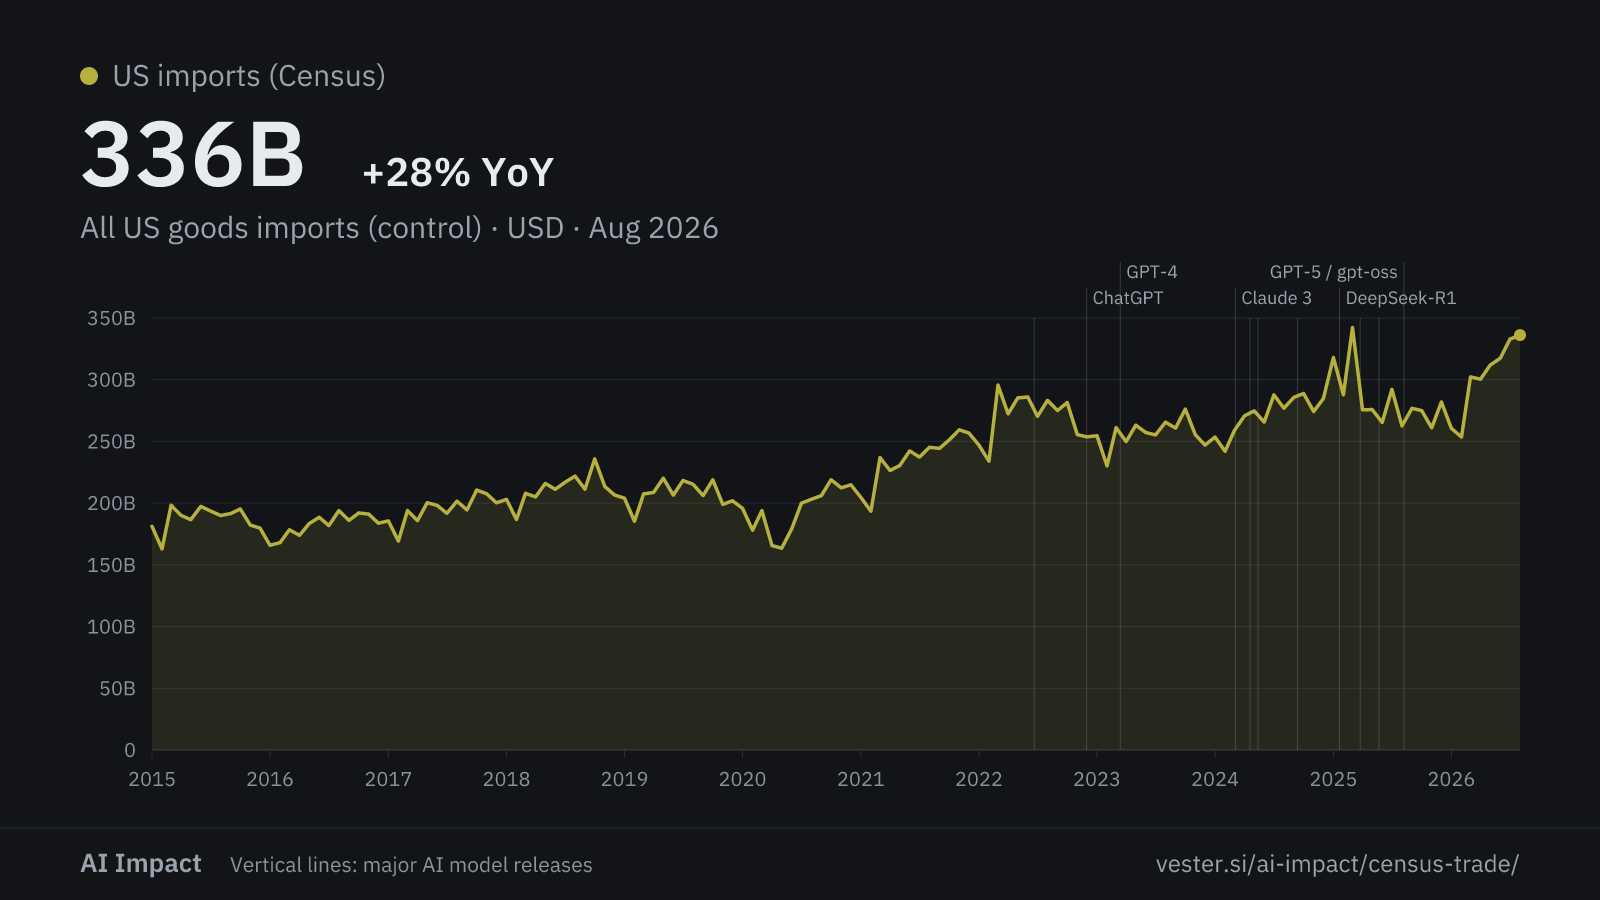
All US goods imports (control)

317B +19.6% yr as of Jun 2026
050.0B100B150B200B250B300B350B201520162017201820192020202120222023202420252026Copilot GAClaude 3Gemini 2.5 Pro
This chart is a control. It adds every chapter of the tariff schedule, and it is what the chart “Share of all US goods imports” divides by.

Derived

Average value per processing unit derived

10.0k +156.7% yr as of Jun 2026
02.0k4.0k6.0k8.0k10.0k201520162017201820192020202120222023202420252026Copilot GAClaude 3Gemini 2.5 Pro
The value of the processing units that arrived in the last 12 months, divided by the number of units.

Figures

SeriesLatestChangeMinMaxCoverage
Processing units (HS 8471.50)24.7B+78.6% yr1.1B25.8BJan 2015 — Jun 2026
Processing units from Taiwan7.5B+11.8% yr12.8M11.9BJan 2015 — Jun 2026
Computer parts (HS 8473.30)14.4B+123.0% yr1.1B14.4BJan 2015 — Jun 2026
Integrated circuits (control)5.0B+37.9% yr2.0B5.0BJan 2015 — Jun 2026
All US goods imports (control)317B+19.6% yr163B342BJan 2015 — Jun 2026
Processing units imported2.0M+9.6% yr1.1M5.4MJan 2015 — Jun 2026
Share of all US goods imports7.8%+49.4% yr0.6%8.8%Jan 2015 — Jun 2026
Average value per processing unit10.0k+156.7% yr1.1k10.0kDec 2015 — Jun 2026
← back to all sources