Google Play (AppBrain)
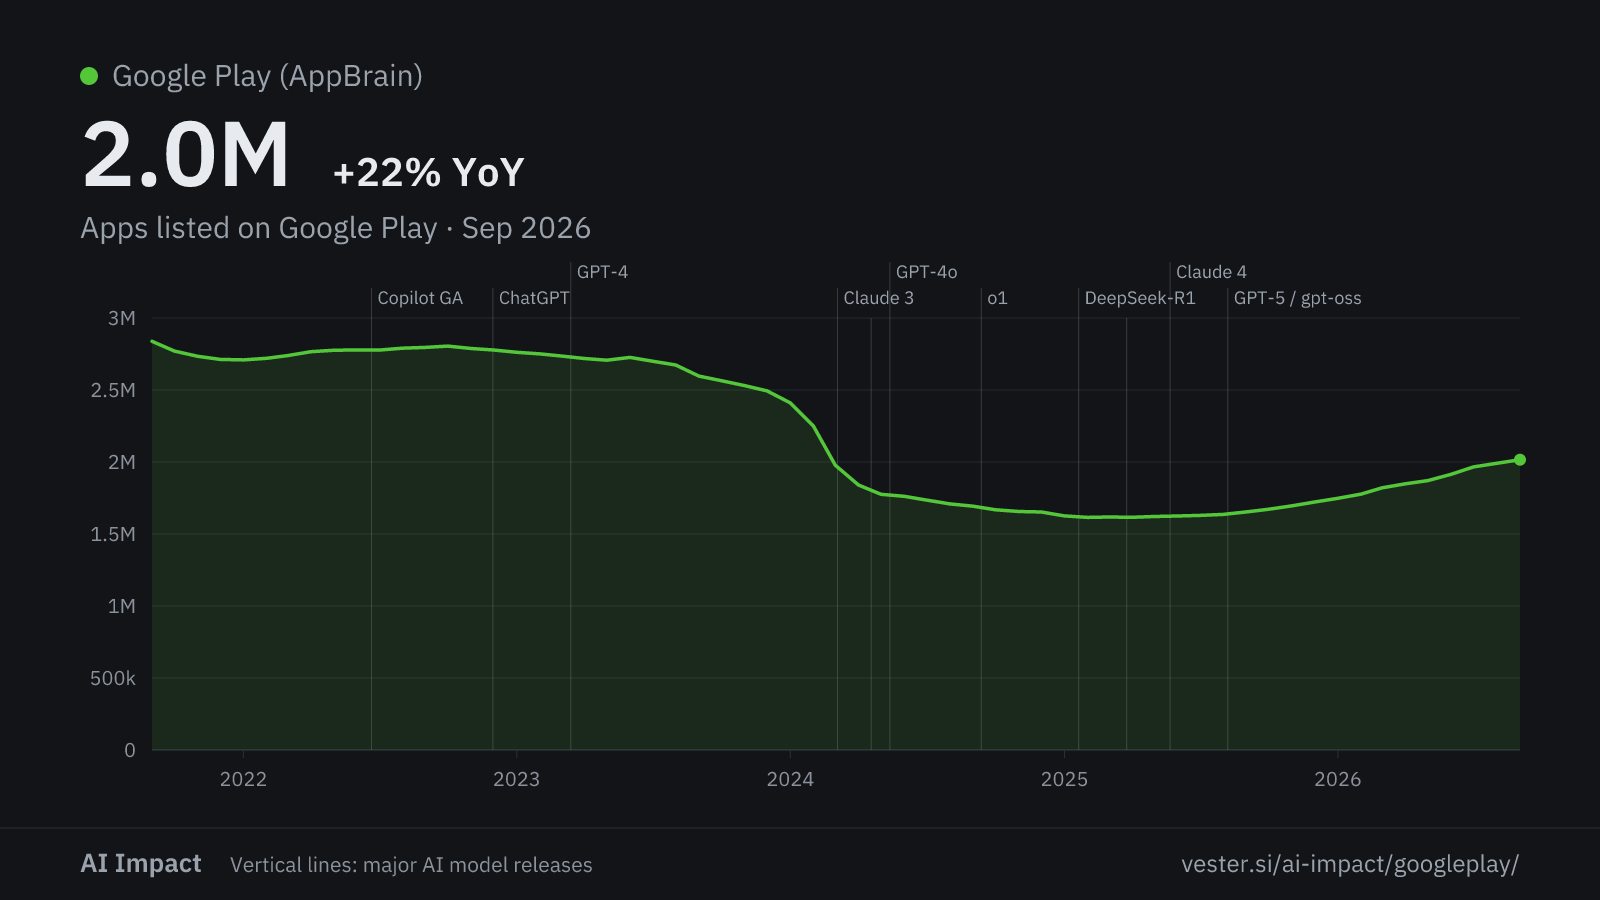
How many apps Google Play lists, how many arrive each month and how many leave. Google publishes none of this, so the counts come from AppBrain, which has crawled the store since 2010. Google cut the store from about 2.8 million apps to 1.6 million between 2023 and early 2025. It has grown back to about 2.0 million since.
AppBrain counts these, not Google. Google publishes no store totals, so this is one company's crawl rather than an official figure, and nothing independent checks it.
How big the store is
What moves in and out
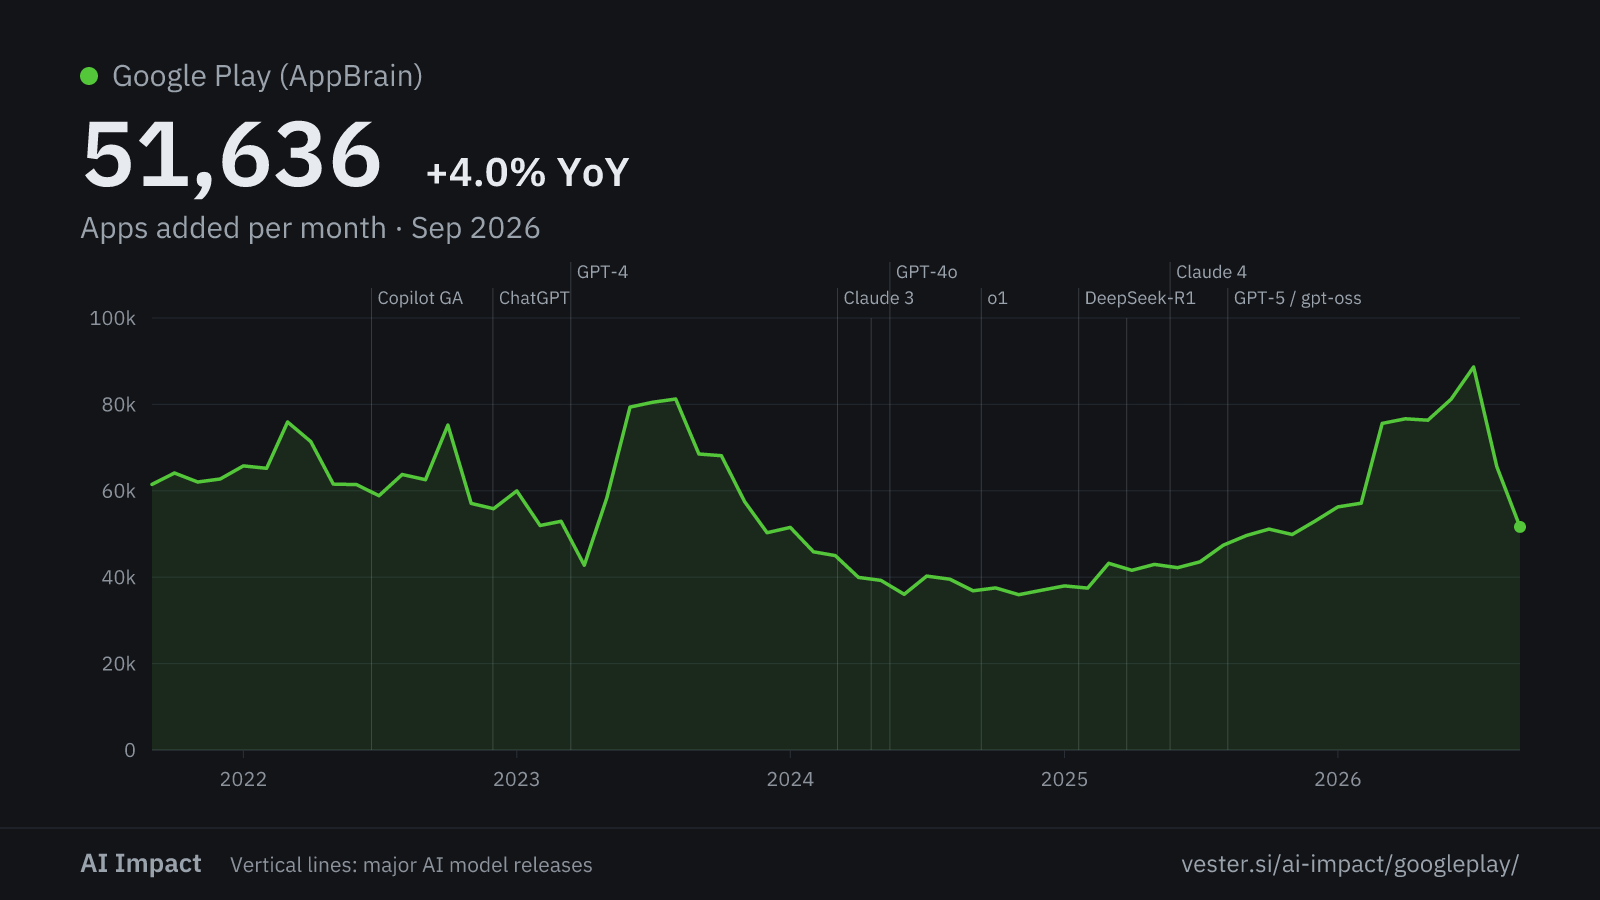
Apps added per month
43.0k −13.3% yr as of Sep 2026
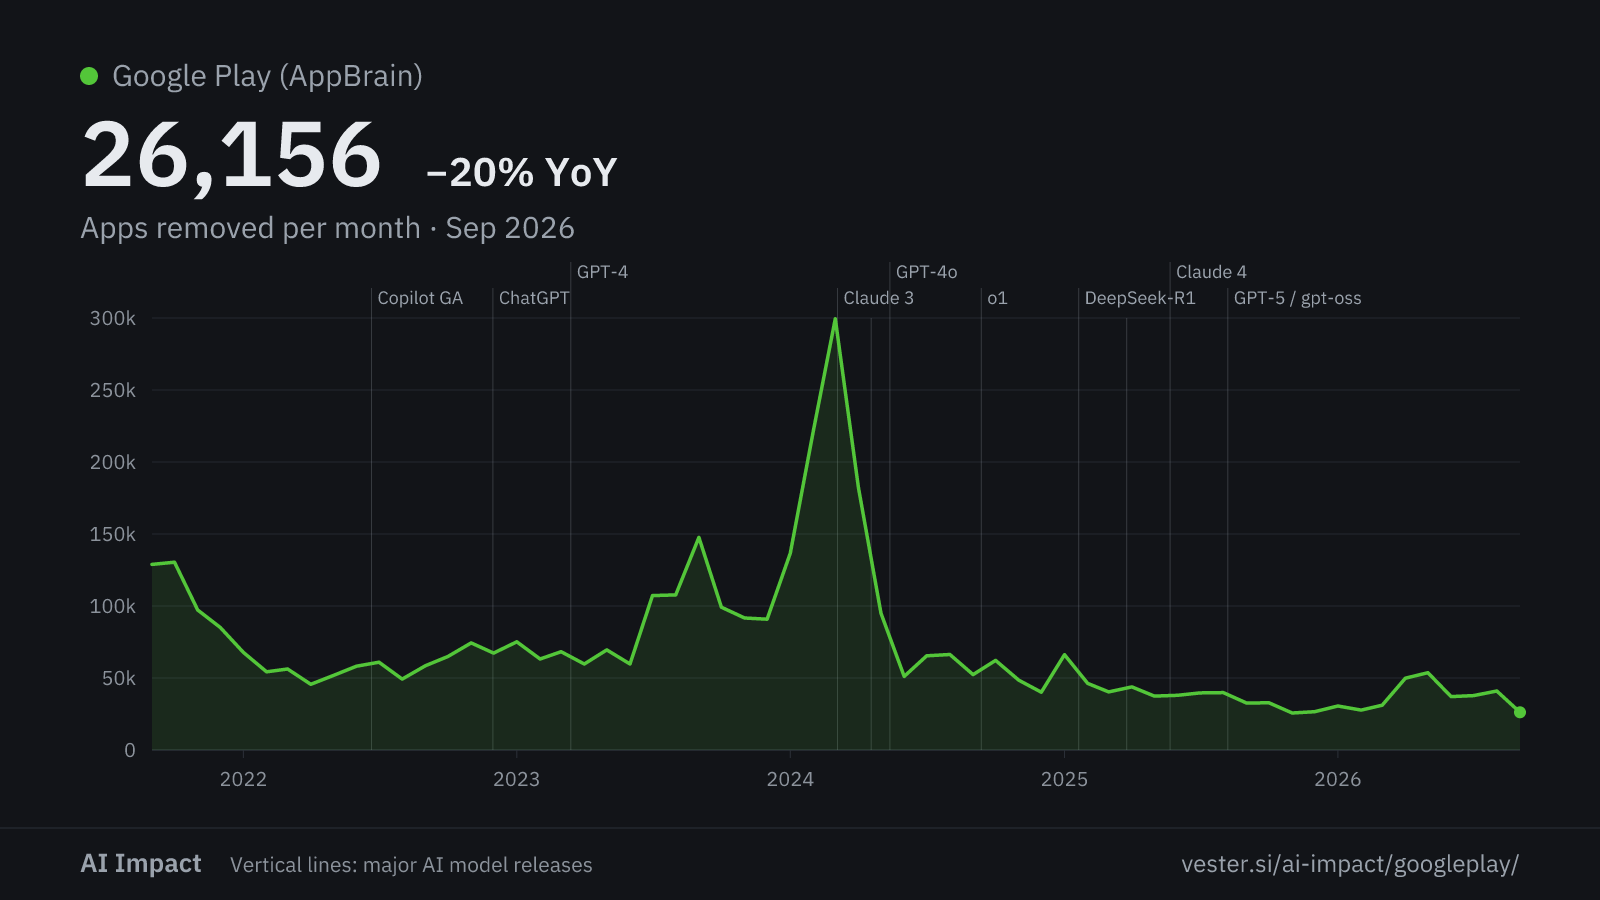
Apps removed per month
16.8k −48.5% yr as of Sep 2026
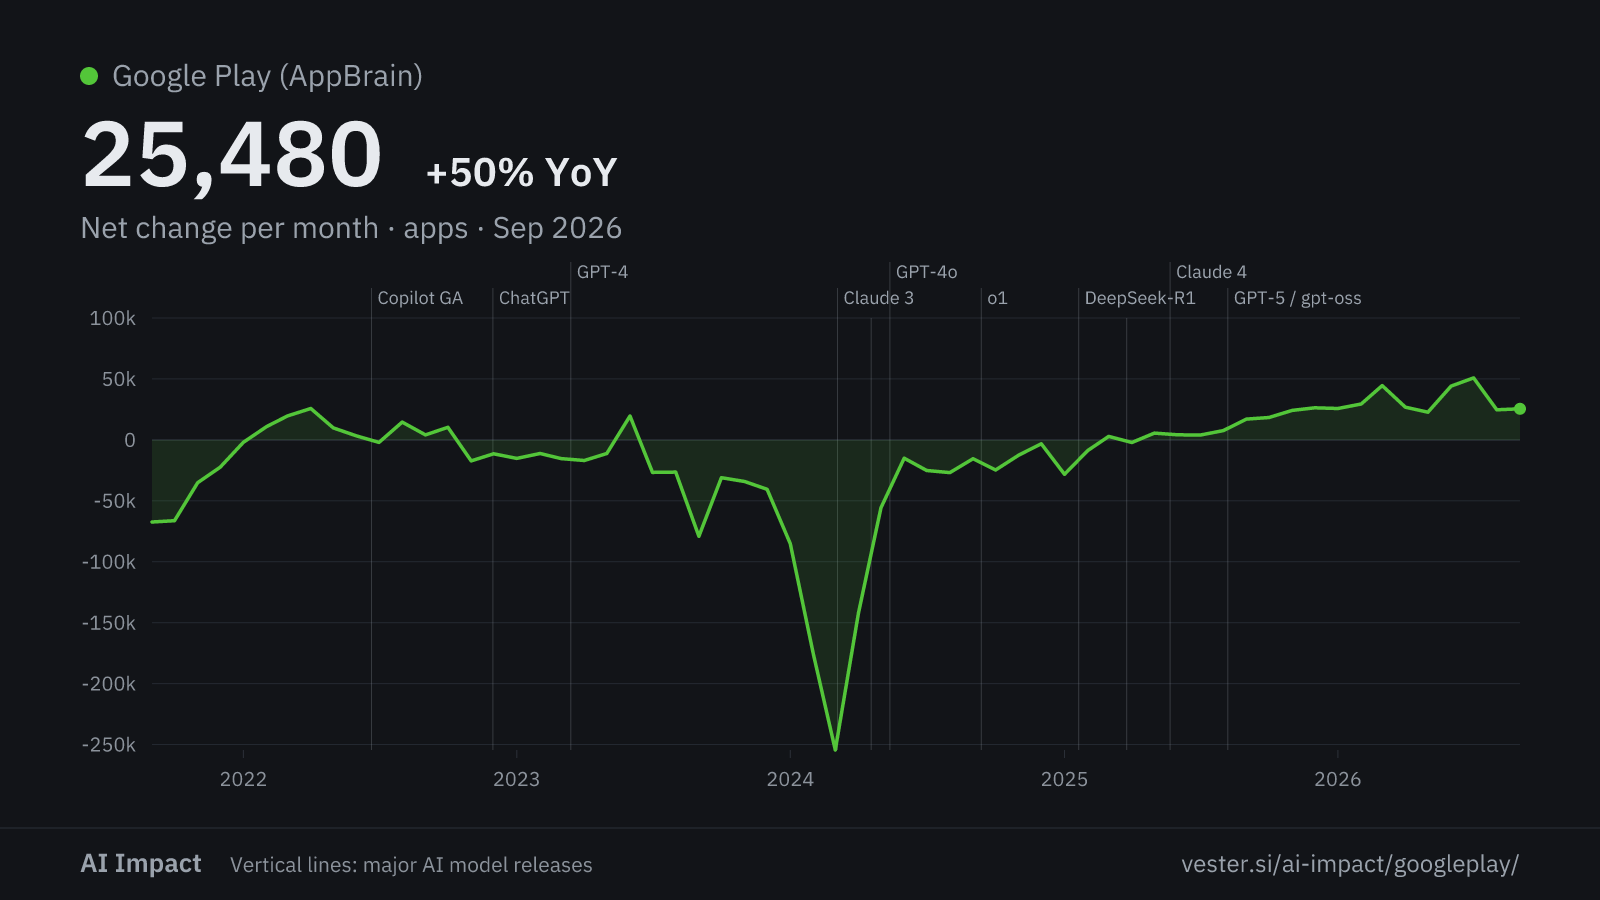
Net change per month derived
26.2k +54.3% yr as of Sep 2026
Figures
| Series | Latest | Change | Min | Max | Coverage |
|---|---|---|---|---|---|
| Apps listed on Google Play | 2.0M | +21.7% yr | 1.6M | 2.8M | Sep 2021 — Sep 2026 |
| Apps added per month | 43.0k | −13.3% yr | 35.9k | 87.8k | Sep 2021 — Sep 2026 |
| Apps removed per month | 16.8k | −48.5% yr | 16.8k | 300k | Sep 2021 — Sep 2026 |
| Net change per month | 26.2k | +54.3% yr | -254.5k | 49.9k | Sep 2021 — Sep 2026 |